The "New Energy Vehicles" Pivot
An asymmetric way to play this trend while avoiding the miners
One should always be on the lookout for when a major narrative pivots.
An example was the shift from 100% renewables to green/zero carbon (to include nuclear and carbon capture).
New energy vehicles will be a way to maintain the 100% EV narrative as zero emission vehicles (ZEV) or battery electric vehicle (BEV) adoption stalls out over time.
This shouldn’t surprise anyone paying attention to the resource requirements of policy such as the IEA’s Net Zero Roadmap (I can’t remember which page below was from…)
Energy density matters, and no amount of subsidies, regulation, or modelling assumptions (learning rates and avoided impacts approach) can change this.
Take this chart from the Net Zero Roadmap (page 161) material intensity drops by 68% if you exclude steel, aluminium, concrete, and silicon, and I shit you not all the waste rock to get the critical minerals (similar, I guess to showing CPI is flat after removing energy, food and anything that dares to rise in price).
Energy density/economics will win out in the end.
For example, look no further than Germany/VW with their renewables and EV push.
Volkswagen AG plans to close at least three factories, eliminate thousands of jobs and slash wages for tens of thousands of German workers as Europe’s biggest automaker tries to halt its tailspin.
The current IEA projections are that BEVs will dominate between 50% and 90% market share by 2035, with PHEVs (plug in hybrid vehicles) playing a 5-10% role.
While heavy trucks are supposedly going to go from a rounding error in 2023 to 20-50% market share in 10 years…
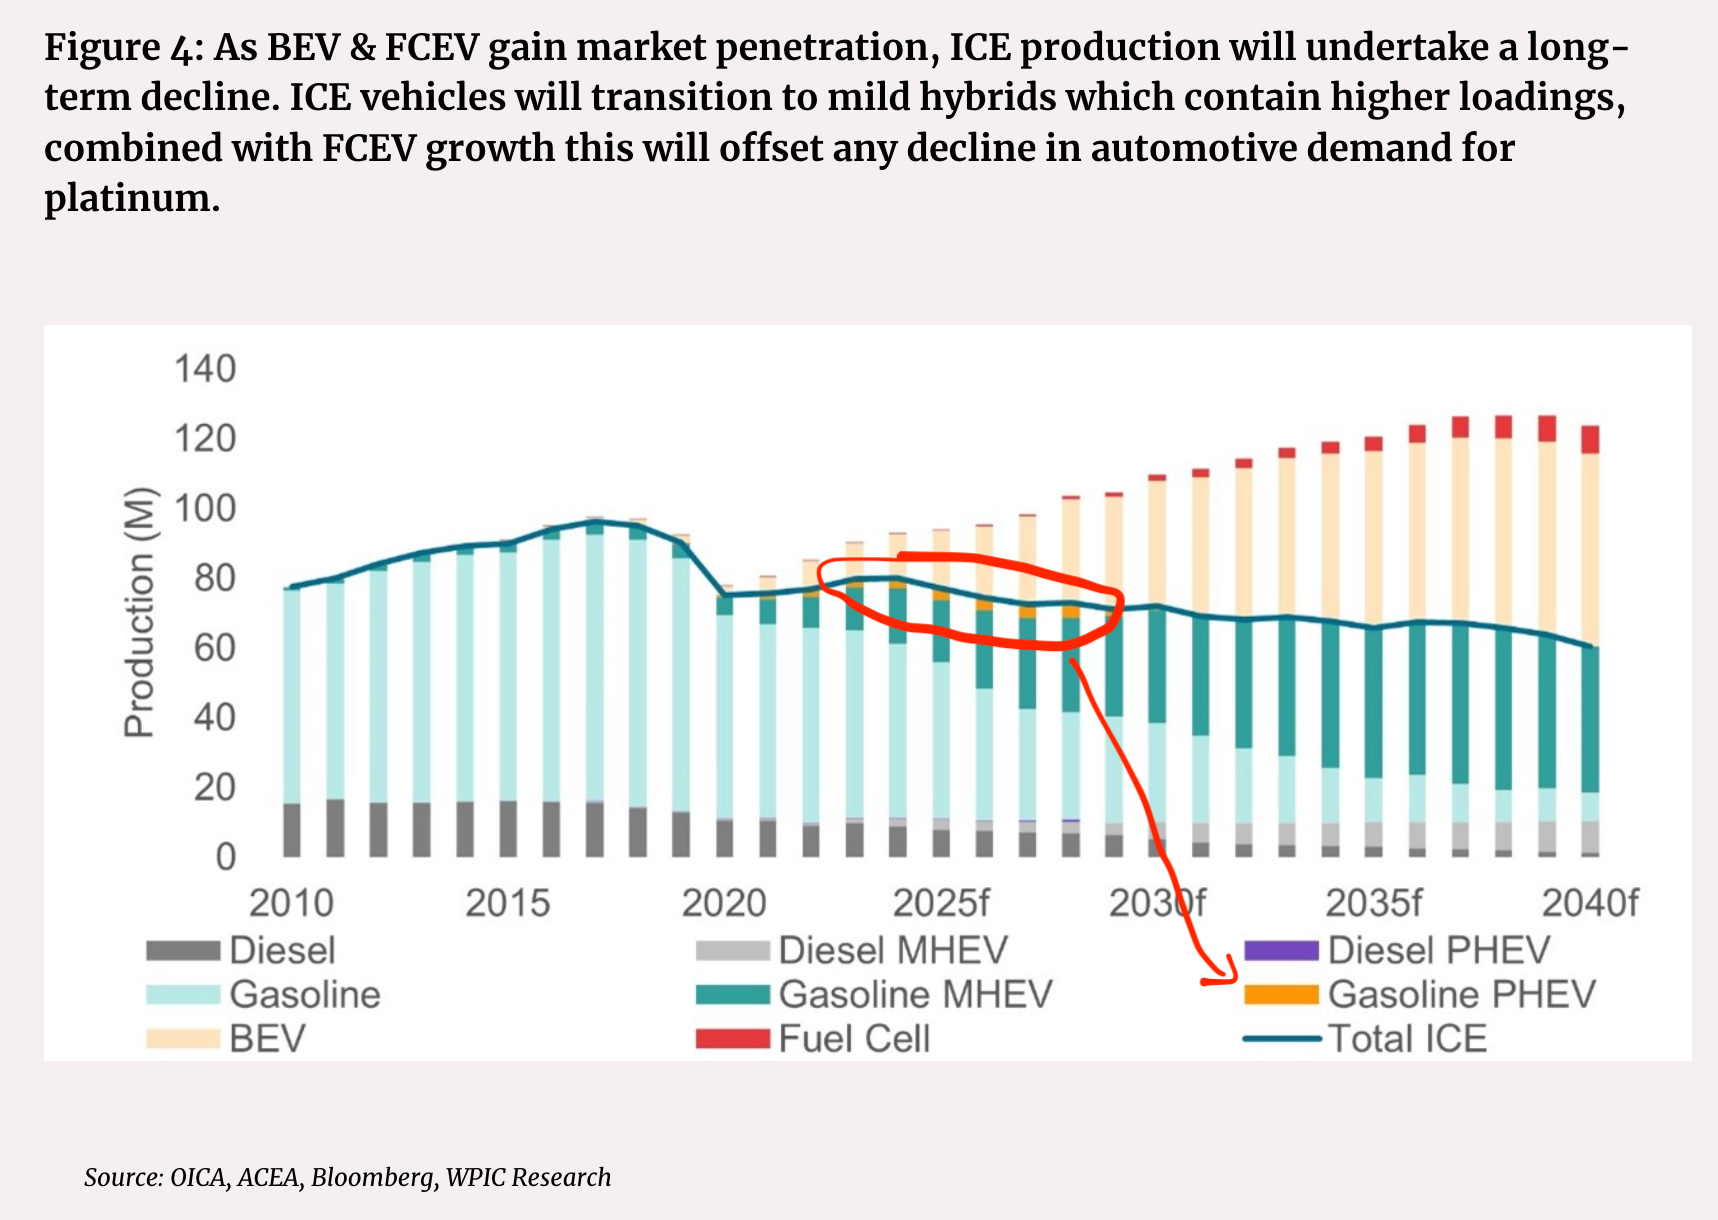
A less extreme forecast is that of OICA, ACEA, Bloomberg and WPIC Research.
They see PHEV as a short-lived phase, with the future split between BEVs and MHEVs (mild hybrids) by 2035.
Mining majors have allocated billions on the certainty of BEV dominating north of 50% market share.
I’m looking for the polar opposite, in an asset where the consensus narrative is it is fucked in terminal/irreversible decline.
This quote was music to my ears having just finished my deep dive on met and thermal coal.
Garvey said the PGM situation had some parallels to coal, which is being phased out as governments slash carbon emissions, but will still be needed for years until more renewable energy is rolled out.
I've already outlined much of my thinking on PGMs here: Pulling the Trigger on Gold and PGMs.
I'll run through demand and supply, and no, this isn't going to culminate in me pitching another PGM miner. If anything, this hedges the PGM miners while likely achieving a larger payoff.
Demand
For those who are new, a quick rehash is that the consensus view is that the PGM market is in for a steady decline due to the reduction in demand for full electric cars.
Platinum demand is best positioned with only 41% for catalytic converters, while palladium and rhodium, with 84% and 90%, respectively, are in trouble if you believe IEA or pretty much any vehicle forecast (BEVs don't require catalytic converters).
The article below was written on 31 January 2024. I note that the PHEV to BEV ratio is 36% this year, and forecast to decline to 32% by 2026.
When you look at the trend of the actual data, it paints a very different picture.
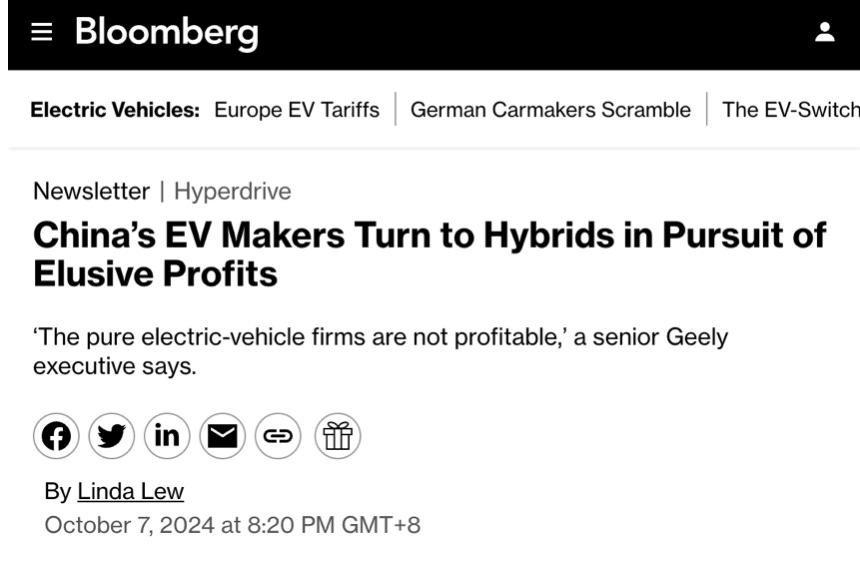
This article hits at the core issue of "pure electric vehicle firms not being profitable," and this is before we get to the second wave of inflation I see coming.
I've been a lithium bear for a long time because I don't see BEV vehicle adoption rates holding up due to material intensity/poor economics and range anxiety/charging constraints (McKinsey: 46% of EV owners said they would go back to ICE cars as their next purchase).
Take this statement from Ford;
“The next generation of Ford EVs will be launched "only when they can be profitable, " Marin Gjaja, head of the Model E EV business, told analysts Tuesday.”
PHEVS > BEV
PHEVs give the best of both worlds with one-third of the critical mineral requirements.
The weighted average battery size for PHEVs for the first half of this year was 23.3 kilowatt hours (kWh), versus 64.5 kWh for pure battery EVs (BEVs), according to consultancy CRU.
To top it off with multiple battery chemistries to choose from with the all the CAPEX having gone to lithium-ion which now sits at the top of the battery cost curve (yes lithium is ion is superior but with a PHEV platform range is no longer a issue.
I see the PHEV/BEV ratio of sales exceeding 75% in 2026.
Which isn’t a stretch when you consider China’s (YTD to October) sales PHEV to BEV ratio is already sitting at 51% YTD.
This is a big deal for the PGM market as PHEVs need roughly 10% more PGMs due to the more frequent cold start of the engine (switching back and forth between battery and internal combustion engine).
Each additional million cars that need catalysts will add about 150,000 ounces of PGM demand, Swarts said.
The main driver of PHEV numbers is BYD. With Sept YTD of the 2.76m "New energy vehicles" they produced, 57% of PHEV, or an additional ~235,000 ounces of PGM demand YTD! (BYD produces ~90% of China's PHEV)
Why the focus on China and BYD?
While western companies like to point to Chinese subsidies as the reason China’s automakers have leap frogged Western automakers there is more to it (China’s EV Makers Got $231 Billion Aid Over 15 Years, Study Says).
To explain it via meme, the Chinese ran a hunger games in each of the sectors they wished to dominate.
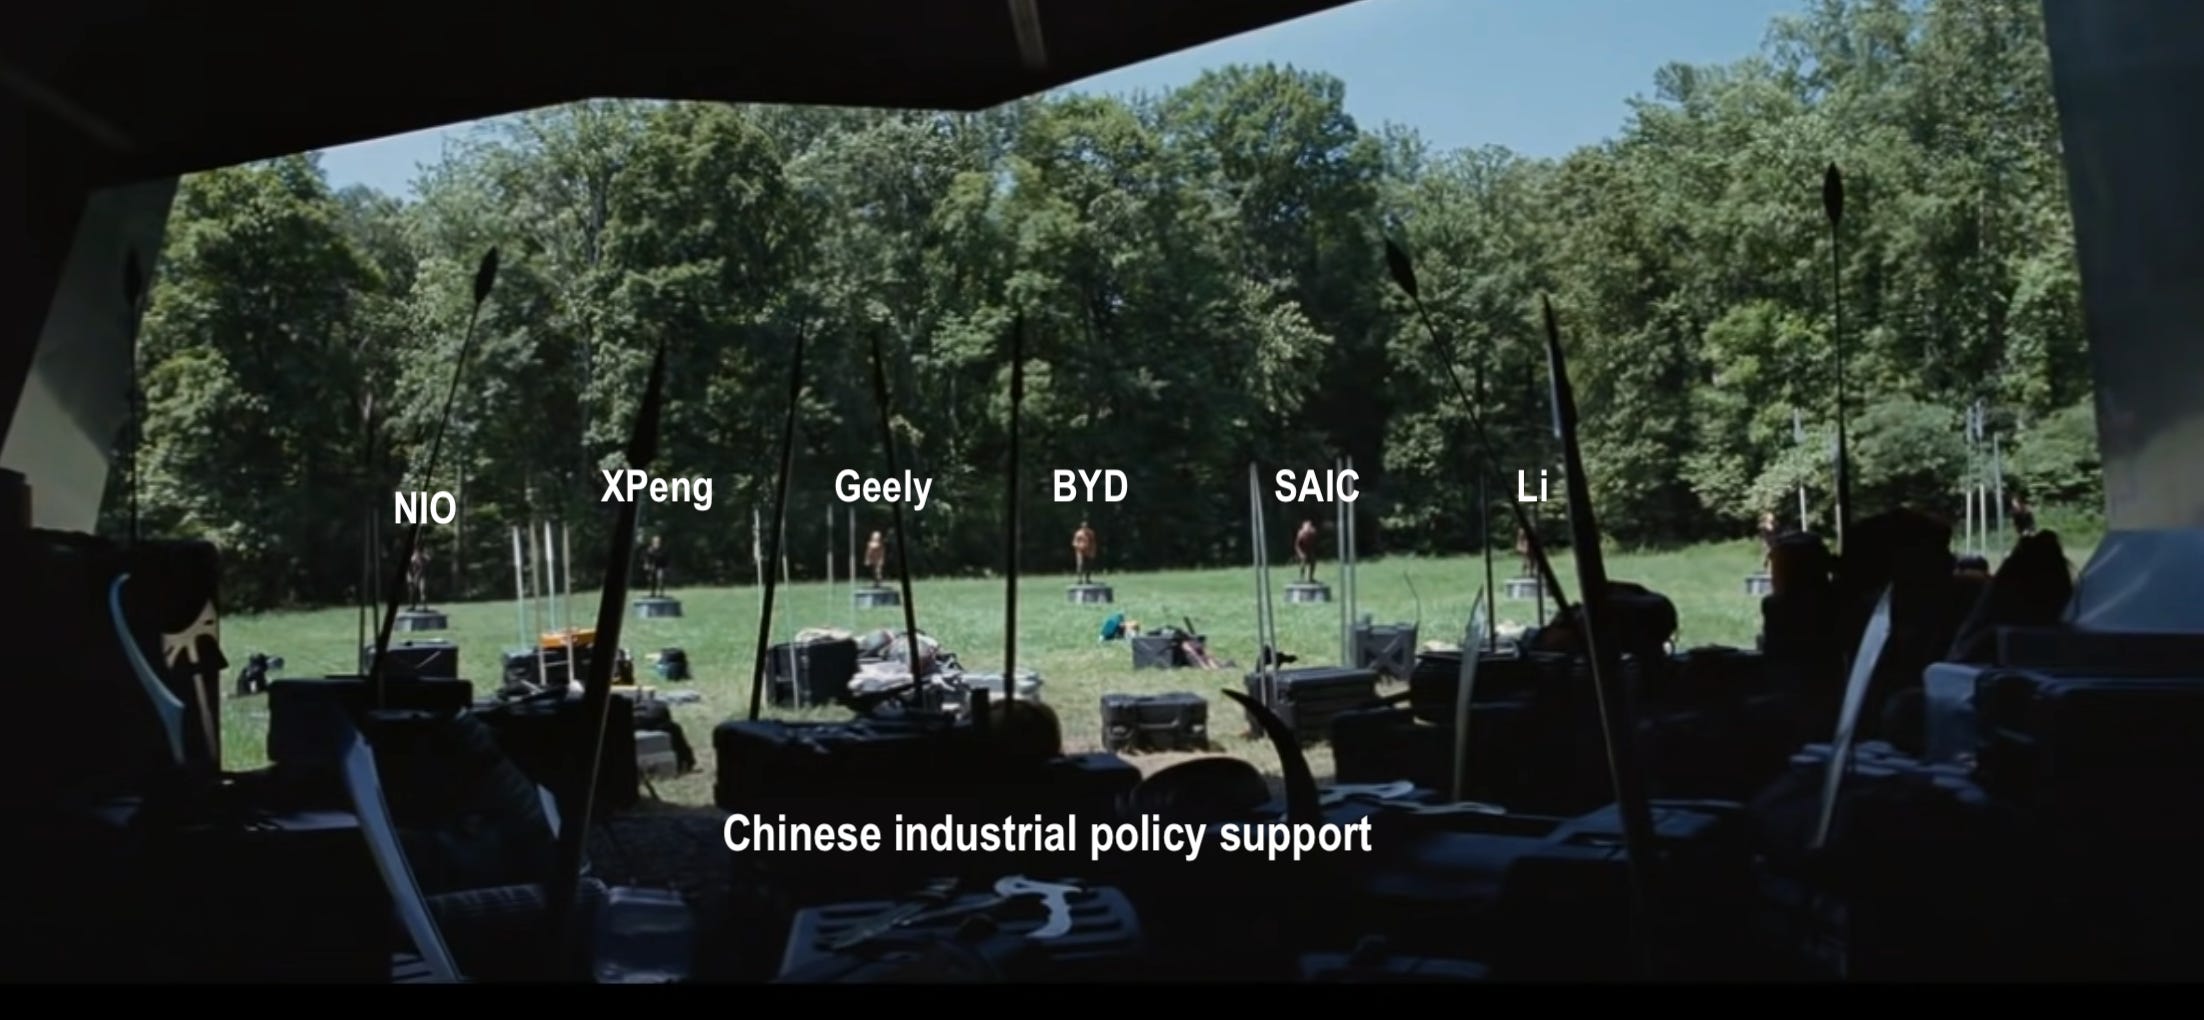
It's the way industrial policy should work: You encourage innovation and competition, with only the best surviving and being globally competitive without subsidies.
Big Market Delusion: Electric Vehicles by Rob Arnott highlighted this delusion back in 2021:
The “big market delusion” is when all firms in an evolving industry rise together, although as competitors ultimately some will win and some will lose.
Hence, my focus is on BYD as it's won the Chinese auto hunger games, and China will ensure it has access to cheap energy and critical minerals/processing it needs to scale rapidly (a luxury none of the below competitors have (bar Changan).
Forecasts of anaemic global auto growth of 0-1% YoY are common, which I think ignores the rest of the world, where all the growth will be (the new vehicle buyer will be in India, Brazil, Indonesia, etc.).
I see Chinese auto sales surprising to the upside with their crazy value proposition.
BYD launched the new DM-i 5.0 PHEV platform and advertised its 2100 km range on the Seal 06 DM-i and Qin L DM-i. Both cars were introduced with a starting price of 99,800 yuan (13,750 USD). Real-world tests concluded with 2.54L of fuel every 100 kilometres.
I mean no Western offering comes close, UBS even dismantled a Seal to assess build quality.
The below trend looks set to continue.
The US and EU were quick to throw up the tariffs instead of rejoicing about the potential emission reductions.
It's not that I'm a bearish Western demand for PGMs, either. It's just more a function of ever-stricter emission regulations and the desire for larger vehicles in the US.
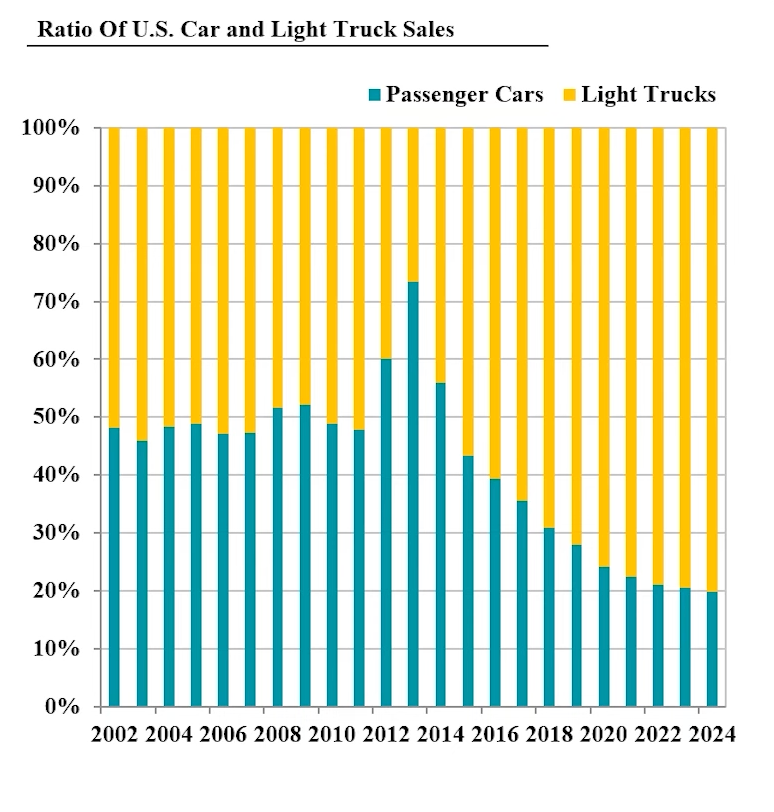
Heavy-truck demand is also a growth market, while diesel trucks don't need a three-way catalytic converter, so they use no palladium or rhodium, driving platinum loading.
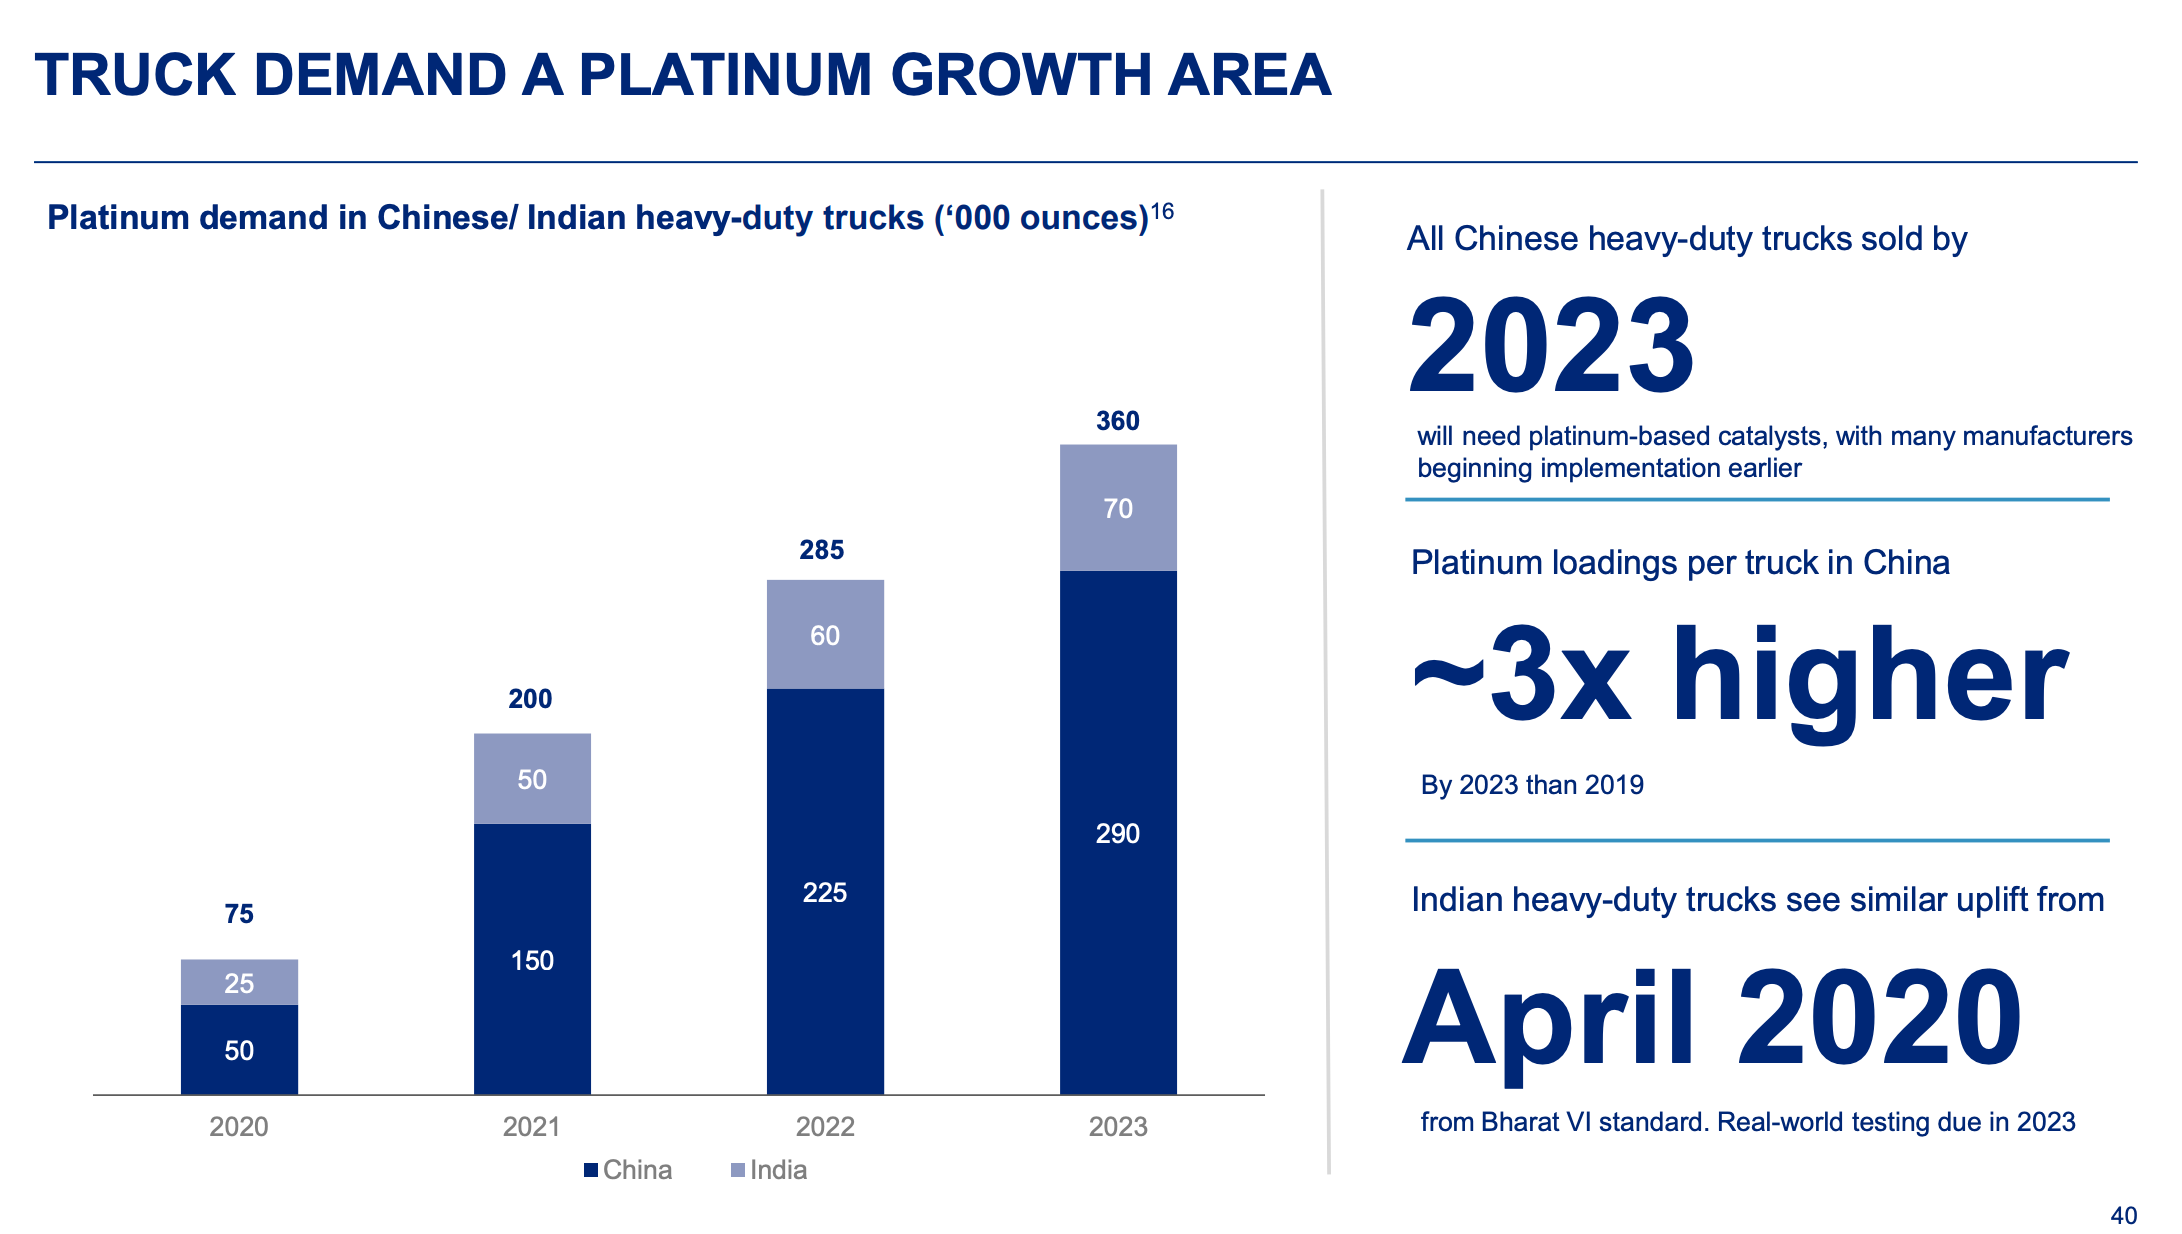
In the heavy duty sector, PGM use rose faster than vehicle volumes. This was not due to any specific legislative drivers, but rather due to a sharp increase in production of large trucks powered by compressed natural gas (CNG). This was particularly evident in China, where low gas prices helped stimulate this market segment. These CNG vehicles use gasoline-type catalyst technology but - despite recent thrifting efforts - they typically require much higher PGM loadings than other powertrains.
Also, interestingly, LNG trucks require three-way catalytic converter to meet China's latest China National VI emission standards (switch to stoichiometric engines from lean burn). Granted I'm not convinced the current LNG trend is anything to be extrapolated more a arbitrage of cheap LNG prices (if I'm wrong, it's just more PGM demand…)
.
What about other demand drivers, i.e. chemical, electronics, glass, etc?
I see most of these adding to incremental demand, but I am mostly interested in getting the auto angle correct, as you'll see from how I'm playing this trend.
I'm sceptical about projections of green hydrogen and fuel cell vehicles as I haven't seen anything that makes economic sense. Take this article which summed it up for me: Why Almost Nobody Is Buying Green Hydrogen
I’ll save you 5mins as this is the crux of the article:
But it’s not a simple switch. Most of the businesses that could run on hydrogen would need expensive new equipment to use it, a leap they’re reluctant to make. Hydrogen produced using clean energy costs four times as much as hydrogen made from natural gas, according to BNEF.
The takeaway on demand is I see PGM demand being similar to coal in it’s going to prove more robust then anyway has forecast.
Supply (the deficits are coming)
The majority of PGM consultants and producers are forecasting deficits. Here is Amplats, Johnson Mathey and Davis estimates which take into account the higher PGM loadings for hybrids and the right hand chart includes platinum loadings for heavy trucks.
This should come as no surprise to anyone paying attention to the PGM cost curve with third of miners making losses at current prices (platinum and palladium just over $1000 ounce).
The small amount of CAPEX planned for PGMs is being delayed, and producers are scaling back production, reminiscent of what we saw in the uranium market.
This isn’t the only issue facing mine production either.
South Africa Load Shedding
Not only do you have the price issues, but load shedding is also affecting miners' ability to operate. It's no small issue either, with Dr David Davis pegging the estimated loss at ~19% SA production potentially rising as high as 34%. With South Africa dominating global production, the estimated loss on a global basis is between 11.5% and 18.5%!
There doesn't appear to be any light at the end of this tunnel for South Africa either, with its coal fleet rapidly reaching the end of its life and Germany advising it on its energy policy.
Recycling to the Rescue?
I don't think so, as vehicle scrappage rates have deteriorated over the last five years, with only a slight bump in recycling activity during the elevated PGM prices of 2021 and 2022.
This take from Johnson Matthey was insightful:
It is now clear that shortfalls in auto sales between 2020 and 2022 have had severe and lasting impacts on the second-hand vehicle market. Compared to pre-Covid levels, the volume of non-realised car sales during this three year period amounted to around 25 million units in the mature auto markets of Europe, North America and Japan. As a result, the flow of one-to-three-year-old vehicles onto the second-hand market has been severely curtailed.
This scarcity of nearly new cars, combined with higher borrowing costs and general cost-of-living pressures, has forced buyers to consider older vehicles than in the past. A budget that would have bought a three-year-old vehicle prior to Covid might now be sufficient to purchase a six- to eight year-old car. This has had a knock-on impact across the entire second-hand market, leading to large increases in the value of used cars of all ages, delaying the scrapping of older cars, and increasing the average age of vehicles entering scrapyards.
It's likely a combination of higher borrowing costs, cost-of-living pressures, and the simple fact that cars are lasting longer.
Above Ground Inventories
This is another bear argument against PGMs, and in particular, platinum: that there are large above-ground stocks. While true, the question is how mobile those inventories are and how quickly they could be worked through.
As for over a decade now China has been stockpiling all the platinum it can get its hands on with zero exports of platinum. Again this reminds me of uranium in the bear thesis that China could dump its large uranium stockpile.
It's illogical. Why would they dump a strategic stockpile when rapidly building out their nuclear fleet? The same goes for platinum. Why would they start selling down a commodity they can't produce domestically and is important to industrial growth aspirations?
The two charts below tell the story.
This is an insightful read on the issue: The Platinum Stock Supply Crisis by Dr. David Davis (Dr. Davis is the expert in this space. I reached out to set up an interview only to sadly learn of his passing earlier this year).
Enough rehashing the PGM thesis. What is the new angle?
It’s not Johnson Matthey Plc although I do find that angle interesting.
It's not another South African miner, that's for sure; if anything, this is an angle to hedge the PGM miners.
A hedge that has historically outperformed the most leveraged miners.
I’ve found a way to buy rhodium in size without being extorted.
Rhodium is a physical metal that acts like a mining junior.
I’m a slow learner, but eventually I get there…
The more I dug, the more I liked the angle.
In my last PGM piece, I outlined how South Africa produces 85% of global rhodium. What I wasn't aware of was how concentrated rhodium production was within South Africa, particularly the Bushvelds UG2 deposit.
Bushveld Igneous Complex (BIC) in which more than 70% of the world’s known platinum resources exist.
The UG2 Reef is observed on the Western and Eastern Limbs of the BIC and provides over two-thirds of South Africa’s primary platinum supply. The Merensky Reef is also observed on the Western and Eastern Limbs and currently yields around 20% of South African platinum supply.
Why this matters for Rhodium?
There are no primary deposits of rhodium in existence. The metal is always a by-product in platinum ores and can be found also in certain nickel deposits at far lower splits.
When you look at the UG2 prill split, you see what high proportion of rhodium it produces at a 9% split, more than double Merensky and Great Dyke 3.8% and 3.9%.
It's 4.5x Nornickels 2% rhodium split, and 7.5x North American rhodium split.
Sorting through PGM pipeline projects such as Sibanyes they are either targeting deposits such as Platreef with a 1:1 ratio of platinum:palladium (3% rhodium split) or Limpopo which is on the UG2 reef but they need to go deep (read expensive).
Due to the steep dip of the UG2 and Merensky Reefs, the project remains an attractive mechanisation option, which fits well with Sibanye-Stillwater’s strategic goals. Development of the project remains subject to Group capital expenditure ranking.
In other words zero chance until prices improve.
The South African reserves are declining steadily against a strong demand outlook.
South African PGM LOM profile is already in a steady decline which is set to accelerate from 2030 onwards.
Global PGM future supply looks like this (granted, Nornickel has delayed its PGM expansion by two years).
The takeaway being all the future supply additions are coming from Russia and Zimbabwe which both have very low rhodium splits.
Rhodium History
Rhodium has quite a cyclical history with its four bull markets, as illustrated below.
Or five if you count the early 1970s pop.
It's a metal that behaves like a junior miner.
Take the comparison below, where it heavily outperformed the other metals and even Sibanye by a wide margin.
How to play rhodium?
Why not buy physical rhodium and store it in a vault?
I went down the rabbit hole of trying to buy the physical. Most metal brokers don't sell rhodium or are sold out to start with.
If you do find one that sells rhodium the premium is hard to swallow at >16% plus the fact they don't let you ship it leads me to assume you get done with a equally nasty bid/offer on the sale.
At best, 16% on the way in and out is a deal breaker for me.
I’m playing rhodium via the 1nvest Rhodium ETF (ETFRHO)
It was previously called the AfricaRHO ETF but this was changed to the 1nvest Rhodium ETF as part of a broader rebranding of the ETF issuer yet some data providers still show AfricaRhodium.
I’ll start with the negatives of the ETF in it’s listed on the JSE and few brokers give access to it.
Plus it looks illiquid as hell.
I passed over it to start simply because I couldn’t get access in any of my brokerages and it looked like I would be repeating the mistake I made with DB Physical Rhodium ETC. Also the 1nvest website didn’t have any links (that worked) to dig into the statements/filings.
I've got John to thank for digging into the ETF and clearing up my misconceptions.
Security of capital
For those not aware Standard Bank Group is my far the largest bank in South Africa (twice the size of it’s closest competitor in FirstRand bank).
1nvest, brought to you by Standard Bank Group
Johnson Matthey holds the rhodium in vaults, and Deloitte is the auditor. So all solid organisations I’m happy to trust some capital with.
Risk of ETF pulling a KOL ETF (delist at the bottom)
There is always a risk with contrarian investments of the ETF droping you off at the bottom of the market as the vehicle does not make financial sense for the provider.
This is a concern with ETFRHO as the fund size is 143,779,050 rand ($8.1m USD) at 0.75% management fee or ~$60k pa.
In my correspondence with Johanne Erasmus (director for 1nvest), he assured me this would not be the case and that they understood the cyclical nature of these metals.
“The AFS relate to the larger commodity ETF company, within which we run the 4 commodity ETF funds in and earn management fees. This enables us to cross subsidise the ETFs as they grow larger or smaller ensuring viability.
We don’t have any plans to shutter any of the 4 ETFs, its important for us to offer the full suit of precious metals ETFs.”
Illiquidity
This another misconception of just looking at volume and thinking this is a Hotel California situation. As 784 rand or $44 USD gives daily liquidity of $16,000.
This is volume is misleading as this is the secondary market volume (trading volume when below NAV). When the ETF trades above NAV (you can track NAV here), new rhodium-linked debentures are issued. Hence, it is actually quite liquid over NAV (assuming the average spot rhodium trade of 300 ounces is $1.4m USD at the current rhodium price of $4,650 USD).
Johanne explained it to me here:
“ETF liquidity is driven by the liquidity in the underlying components and not the ETF itself. In the case of ETFRHO, this will be the daily spot rhodium trade and the spot USD/ZAR trade (ETFRHO is listed on the JSE and priced in ZAR), with the latter being one of the most traded currency pairs.
Its important to note that spot rhodium is a lot less liquid that the other PGM metals, platinum, palladium or gold, and mostly driven by the producers, manufacturers and fabricators depending on the industrial supply and demand at the time.
Spot rhodium currently trades on average between 300 ounces to 1000 ounces a day, market depending. As a rule of thumb, on a normal day we can do around 300 ounces without moving the rhodium spot price, but larger size is possible (we have done up to 5,000 ounces in a day). At its peak the rhodium ETF had about $ 65m
The current bid/offer for rhodium is also much wider than the other PGM’s, currently about USD 4,600 and USD 4,650, and can move quickly.”
As for redeeming debentures, you can usually sell near NAV in secondary, or if you need to redeem in size, you will need to accept the wider bid/offer, but as illustrated above, the spread isn’t bad at all.
How the ETF functions?
This was the first time i’ve come across debentures, and was confused at first how they could be unsecured yet tied to the physical metal.
John explained this to me:
The debentures are referred to as "unsecured" because they are not backed by specific collateral (like the physical metals) but are instead obligations of the company. Their value is linked to the prices of the underlying metals, but the holders do not have a direct claim on those metals. This unsecured status means that debenture holders are general creditors, relying on the company's ability to meet its obligations rather than on secured assets.
The AfricaRhodium Trust is a legal entity created to protect the interests of debenture holders and creditors by holding and managing security (collateral) that backs the debentures. If the issuer defaults, these trusts are responsible for enforcing the security and distributing assets. However, creditors and debenture holders cannot directly enforce claims, they must work through the Security Trust unless the trust fails to act. If the trust becomes insolvent, the security arrangements may be bypassed, potentially reducing the protection offered to the debenture holders.
Debenture holders are protected through a Security Trust that guarantees the ETF’s obligations. The Security Trust’s liability is limited to what it can recover from the ETF Company through the indemnity and security. The ETF Company’s indemnity is backed by the rhodium holdings, providing a form of collateral to support the Guarantee. This structure helps mitigate risk for investors by ensuring that there is a mechanism in place to cover the ETF's obligations, although it also limits the extent of protection based on what can be recovered under the indemnity and security arrangement
This mechanism prevents it from facing the issues of closed-end funds (trading at large premiums/discounts to NAV). Since they issue and redeem debentures to keep the ETF close to NAV.
As Johanne outlined, they currently can trade between 300 and 1000 ounces per day, with them having traded up to 5000 ounces in a day. For context, rhodium's total annual supply is 1m ounces (704K primary, 295k secondary).
So you can see how if inflows accelerated, this could squeeze the price with 1000 ounces being 0.1% annual demand and 5000 ounces being 0.5% of either global market traded in a day!
How to get access to the ETF?
Saxo Bank is the only broker I’m aware of that allows you to buy it (I mentioned Easy equities when I first published but be warned a number of members have had bad experiences with them!)
Saxo Bank access depends on where your account is opened with some areas making it more difficult in you need to upgrade your account to professional (which I had to do to buy it).
Yes there are other brokers like UBS that friends have brought it through but if you have a high end brokerage, then you probably already have worked this out and I don’t think anyone is going to go through the hassle of opening them just to trade this ETF!
Some Risks
Besides the obvious that the whole thesis is incorrect and BEVs ramp in line with IEA’s projections I see some key risk to be mindful of.
Substitution/replacement is a real risk and a reason you can’t really size this up like you could with, say, physical uranium.
For an example of this risk, look no further than cobalt.
Or the recent (2020) example of BASF launches a new Tri-Metal Catalyst “Innovative technology enables partial substitution of palladium with platinum, enabling a reduction in catalytic converter costs”.
Granted this risk is most likely to materialise after price does something silly driving the innovation. So pays to have a exit plan (trim aggressively on the way up).
Two is just being too early, as maybe there is enough inventory to supply the market for another few years (similar to uranium, where I was sure utilities would have been forced to contract in size by now if you’d asked me two years ago).
Or, to use Rick Rules line: “I confused the inevitable with the imminent.”
I can’t point to any immediate catalysts other than demand, which will hold up for the factors I outlined, and supply, which is facing a number of headwinds that will only increase moving forward.
The opportunity cost is maybe we are at 2011 and have a long slow grind lower ahead of us. That said the with the inflation I see coming and the state of the South African mining complex I’m happy to eat the 0.75% management fee and a drawdown in order to capture another rhodium bull run.
I mean the chart is a thing of beauty, and don’t want to miss this thing breaking out.
Conclusion
I'm targeting 5% position for ETFRHO I’ve brought 4% currently at 78.660,00 ZAC and will bump it up when find the cash.
Update
In my original piece I said not to touch the DB Physical Rhodium ETC (XRH0) as the ETC ceased to issue new securities in January 2016 and DB hadn’t had their rhodium audited in 2024.
They have uploaded the DB-ETC-Plc-Physical-Metal-Audit-2025.pdf which confirms they have 7282 troy ounces or 226.50kgs of rhodium sponge. The suspension only affected the creation of new units, but existing units continue to trade, allowing investors to buy and sell through the secondary market rather than through direct creation/redemption. The secondary market is pretty illiquid but if you only use limit orders and are patient is manageable and this ETC is far more accessible than ETFRHO.
Cheers,
Ferg
P.S. The Position/Portfolio Directory has been updated.


Ferg, While in SA visiting PGM mines in the late 1990s sentiment was so bad that when one of the miners gave me a beautiful pair of cufflinks the big joke was...they're 1 ounce of rhodium each...we have to give it away these days...still own them...
nice write up! you love these obscure plays ;) maybe I missed it but I do not fully understand how you came to arrive at rhodium over platinum. is it simply because of the concentration / exposure to automotive and no dedicated mines?
- 75% of platinum comes from SA (mine / country concentration)
- platinum has a clearer line of sight to inventory (RH does not)
- platinum has multiple demand sources only 40% automotive - means automotive is competing with more sectors and has less pricing power, in theory
- rhodium has no heavy truck demand (platinum does)