I’m assuming you’ve read my “Why Oil is a Fat Pitch Here” prior to reading this since I’m going to be tackling the question of where is the additional oil supply going to come from?
While the Net Zero crowd continue a game of “feel-good, make-believe”, the cold hard reality is that we need to arrest the decline shown in the below chart; otherwise, global growth and living standards are going down the toilet.
“To talk about energy and the economy is a tautology: every economic activity is fundamentally nothing but a conversion of one kind of energy to another, and monies are just a convenient (and often rather unrepresentative) proxy for valuing the energy flows.” -Vaclav Smil
It’s no secret that conventional onshore and shallow aren’t going to plug the gap. Bison Interests piece: The Myth of OPEC+ Spare Capacity was the first to open my eyes to the issue.
Since then, it has become evident that the Saudis don't have what they say they have. When they first attempted an IPO targeting $2 trillion, they were laughed out of the room, so instead IPOed in their domestic market and "encouraged" a few Saudi princes and elites to prop up the price or get invited for another stay at the Riyadh Ritz-Carlton.
This article touched on the smoke and mirrors: Saudi Aramco's $2 Trillion Valuation Is an Illusion
“The liquidity in Aramco shares is abysmal: a daily average of just $51 million worth of stock changed hands over the past year, according to data compiled by Bloomberg. Compare that with nearly $2 billion for Exxon Mobil Corp. For Apple and Microsoft, the figures are $11.2 billion and $7.5 billion, respectively.
It isn’t just that liquidity in Aramco is low — with just 2% of the shares available for trade, that’s not such a surprise — it’s also troublesome that many buyers and sellers are involved in what looks like merry-go-rounds.”
Conventional onshore isn’t going to be the saviour and is likely to disappoint moving forward.
Consensus up until recently seemed to be tight oil would “drill baby drill” as oil prices rise, providing additional supply when required.
The reality is the majority of shale growth is in the past. I recommend reading this great piece by Javier Blas for a decent overview.
“The go-slow is a business reality. Over the last decade, the US shale industry had become a byword for capital destruction. Shale investors recovered about 50 cents for each dollar they invested during the 2010-2020 period. After riding out the pandemic, the industry is under increasing pressure from impatient stakeholders on Wall Street — the actual embodiment of the financial system, not Midland’s mock version. Shale pioneers once put growth over profit, burning billions of dollars in the process; today, they are focused making money for their shareholders.”
With the Eagle Ford and Bakken in decline, it will be challenging to maintain current production with the high decline rates, let alone grow production.
Even the Permian looks to be in the process of topping out. Adam Rozencwajg put forward an interesting take on it here. To badly summarise, it is that the Permian is a mixed medium reservoir where the gas is dissolved into the oil. The gas growth has been double that of oil, to which Adam draws the analogy of a can of soda going flat, which will make future oil extraction more difficult.
The Permian production appears to be topping out.
With conventional and shales’ ability to ramp questionable, let’s dig into offshore.
The Shift Back to Longer Cycle Economics
After the 2014 oil bust, there was no appetite for long-cycle oil investments, so multi-year, multi-billion oil projects were put on ice. In 2019 things were looking up, then COVID happened and being long oil required an adult diaper.
The promise of short-cycle shale oil with 2-month paybacks and ~$10 million per well costs were where the CAPEX flowed. This showed with all the added supply over the last decade being shale.
When you starve a sector with billions of sunk costs, it should be no surprise they will cut costs to the bone to keep things operating. Hence charts like these with cost reductions per segment up to 80% for floating rigs which dropped breakevens from $91/bbl to $46/bbl in 2017.
Not that this helped much with the shale boom in full swing, longer cycle projects didn’t stand a chance. Come 2020, breakevens for deep-water were down to $43/bbl in line with shale yet; investors demanded capital returns and not billion-dollar long cycle offshore projects (which wasn’t helped by the narrative at the time of peak demand).
By mid-2020, things looked hopeless, and the majority of the offshore drillers went bankrupt over the next year or so. Diamond Offshore filed on April 2020, Noble Corp on June 2020, Valaris on August 2020 and Seadrill on November 2020.
The bankruptcies and subsequent restructuring wiped approximately $20 billion off the balance sheet of these companies, so it was no surprise that breakevens continued to drop, most recently hitting $36/bbl, below shale and surprisingly close to the onshore Middle East at $32/bbl.
Average breakevens can be misleading, so here is the distribution of resources, with 51% being sub $40/bbl.
The reserves are there, with offshore making up 45% of Majors’ proven reserves. The economics just needed to make sense.
With the reduction in offshore breakevens, one can see the trend looking at committed offshore projects vs onshore.
Offshore deep and shelf is now eating onshore’s lunch.
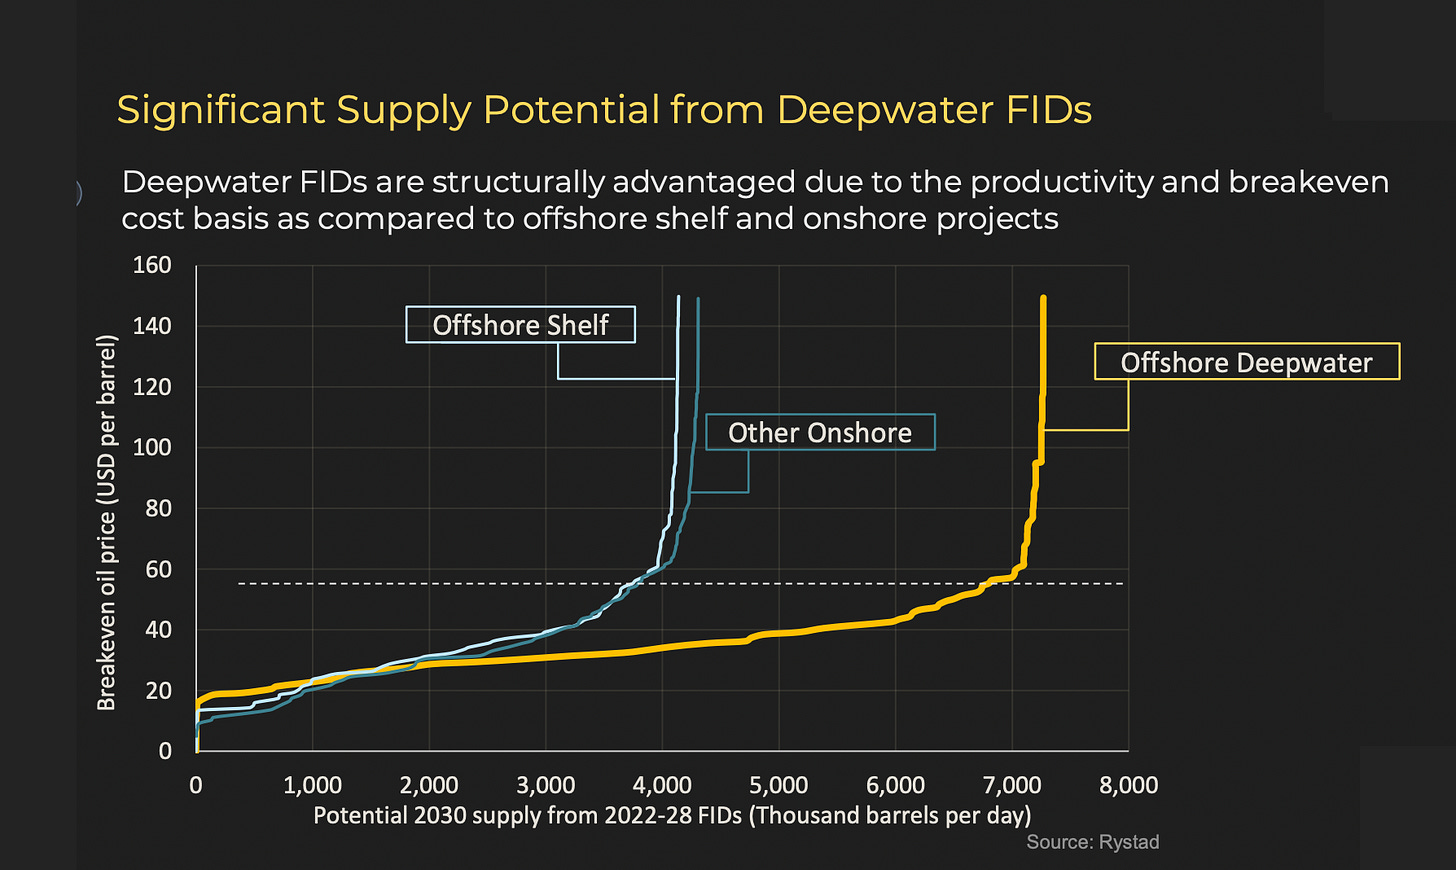
When looking out further from 2022-2028, FIDs (final investment decisions) deepwater offshore is going to play the largest role in plugging the oil supply-demand gap.
What is going to get the CAPEX flowing?
All of the above is interesting yet useless if Majors continue to return record free cash flow capital to shareholders and the investment ratio stays at record lows.
I’d argue we are already seeing this turnaround as Majors no longer have to fight “shareholder” Green aspirations (by shareholders, I mean Vanguard and BlackRock backing activists with 0.02% ownership).
We are seeing Majors pivot back to oil as returns fail to materialise from their Green FOMO investments. Take this example: BP and Total Pay Hefty Premium for Offshore Wind Rights
“BP led the bidding with an offer about 80% higher than the average of its competitors in the auction for sites in the waters around England and Wales, an area it’s long familiar with through its oil operations.”
It was a predictable story ark of a business insisting it won’t do the “unpopular profitable thing” to do the “popular thing” before pivoting back to the profitable thing.
I even altered/created a cartoon for it back in October 2020.
How to Play Offshore?
I’m a sucker for a post-bankruptcy company that has wiped out its debt and has a dirty big moat in the form of rigs or OSVs trading for a fraction of their replacement cost. If you want an example of this, here is a pre and post-video on Diamond offshores relisting, which has yielded a nice low-risk 100% gain to date.
As different areas of the offshore service sector approach full utilisation and day rates begin to rocket (we are already seeing this while oil is still in the doldrums). These companies become cash printers for a period of time before eventually overordering new rigs and reverting back to being shitty businesses for another decade.
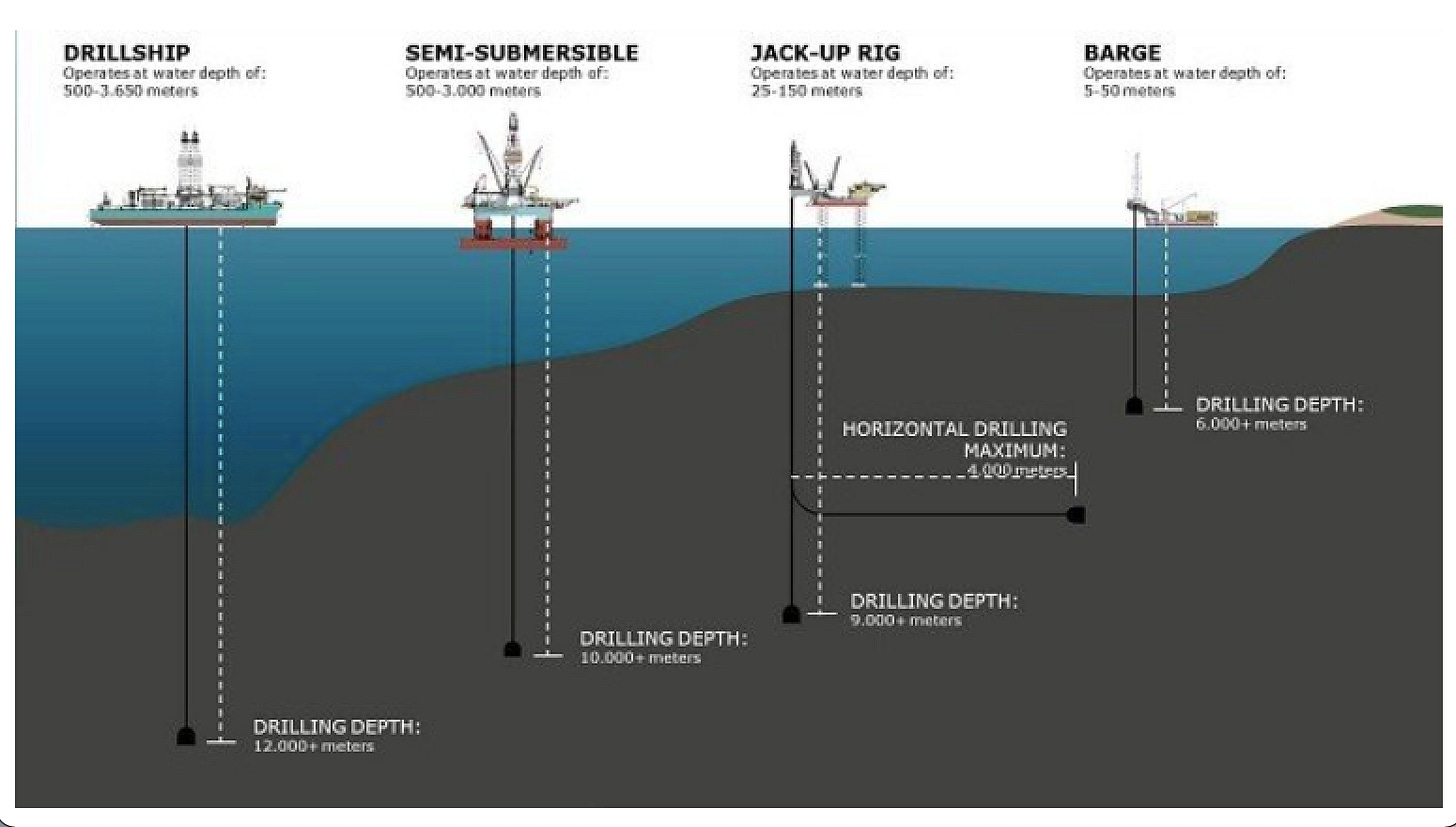
An example of this chain reaction is as drillships hit full utilisation, semi-submersible utilisation takes off (since newer drillships have been eating their lunch by servicing their drilling depths); this then feeds into the OSV (offshore service vehicle) market as you need four OSVs for every operational semi-submersible.
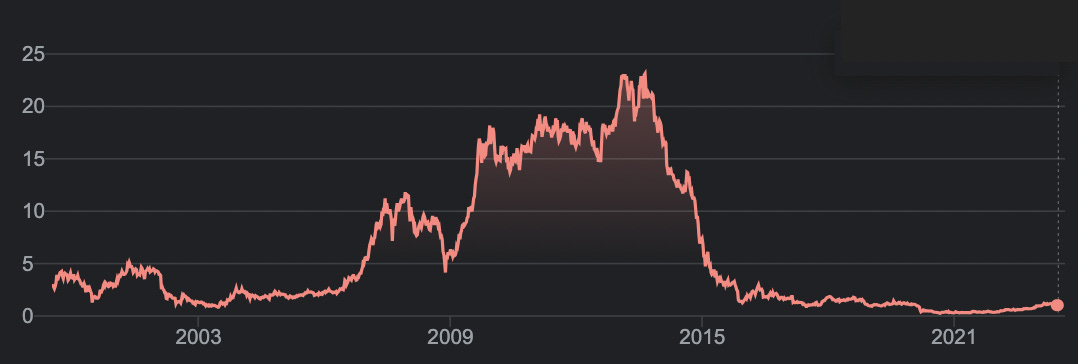
I’ve been having a great time hanging out in small illiquid offshore plays that 99% of investors have left for dead. Super cyclical that have done nothing but lose money for the past decade.
Charts like this have left a whole swath of investors with PTSD and sworn never to touch this sector again.
Yet below the scenes, these companies are all on the move (with oil in the doldrums, I might add).
Take these four tiny offshore-orientated companies; they are all sub $400m market cap, so they are too small for funds/institutional money and too hated for 99% of retail to touch. So they are generally held by insiders, deep value investors and bagholders from the last cycle. This dials down the volatility while maintaining huge optionality to the upside as the money starts to flow into the sector again.
If hunting out optionality isn’t your jam, there is still a tonne of value to be captured via ETFs like XES (SPDR S&P Oil & Gas Equipment & Services ETF), which is equally weighted (better than cap-weighted OIH ETF).
It’s quietly grinding higher while no one is taking notice.
For me, this is where the real value hides in cyclical sectors essential to humanity that have gone through a consolidation/bankruptcy cycle, and the mention of them makes most investors shudder.
Yet, as Howard Marks likes to say:
“Rule No. 1: Most things will prove to be cyclical. – Rule No. 2: Some of the greatest opportunities for gain and loss come when other people forget Rule No. 1.”
Cheers,
Ferg
P.S. This will be my last free post for a few weeks as I focus on providing value to paying members. If you’re unfamiliar with my story, you can read about it here: Positioning Myself to Get Lucky.
If you wish to join me as a paid subscriber, I'm offering two paid subscription tiers:
Trader Ferg – subscribe at the basic level for access to regular videos and writeups ($280/year or $28/month)
Trader Pro – the Pro level adds a monthly "ask me anything" session, regular chats with my mentor, and a occasional write-ups. There is also a Discord for answering questions and posting opportunistic trades I'm doing/trying to get filled in the market. ($650/year)
Those who remain on my email list but choose not to subscribe will still receive the weekly Ferg's Finds and occasional long-form posts.


Thanks for this - How can we find out the names of those 4 tiny off-shore companies?
Ferg Have you heard of DOF Group? I just came across them, they have just done a restructuring in June this year of (I think $US2B) debt. Almost 4000 staff They are a global OSV company with approx 90% utilisation rate and 54 vessels. John Frederiksen was a big part of the restructure. I think they relisted at 28 Nok and it's now around 38. From what I can gather that gives it a MC approx $US675m (160m SOI).
https://www.dof.com