This is a post where I throw around a heap of charts I think have big implications, but probably won’t get around to writing up in detail.
I’ll start with the scariest chart in finance (H/T Paulo).
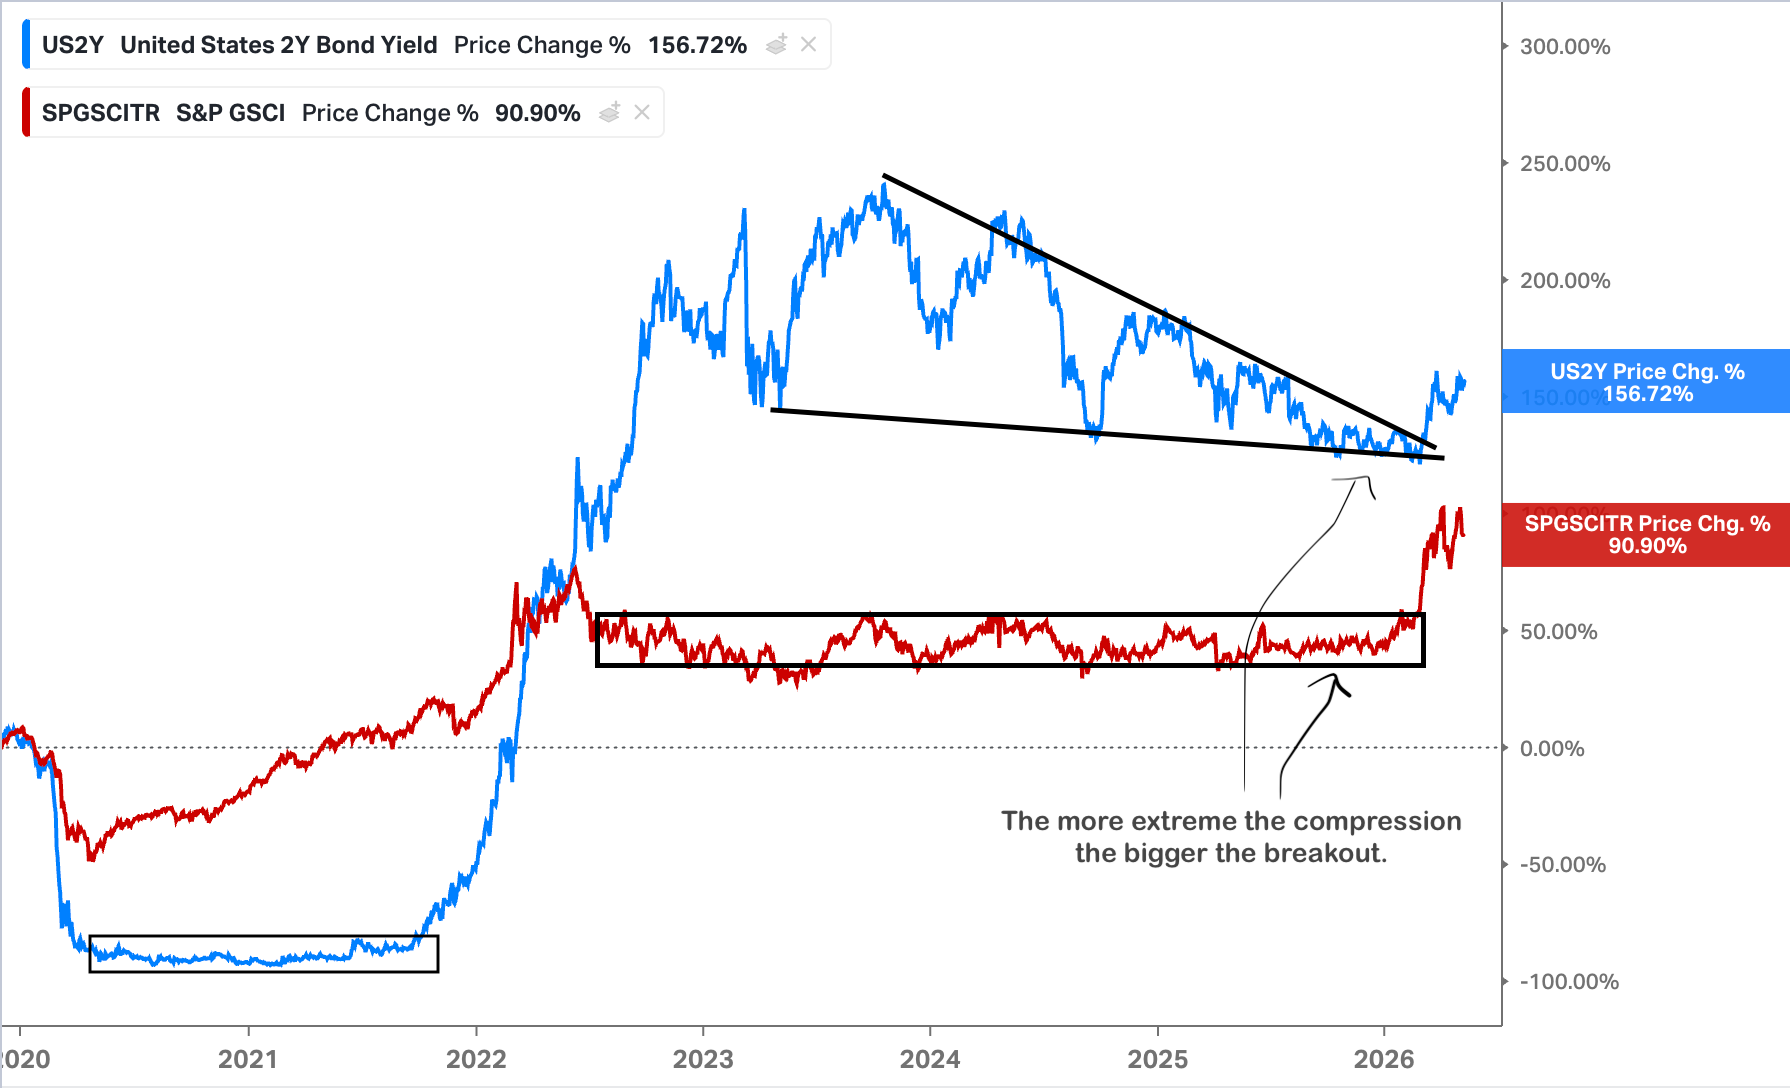
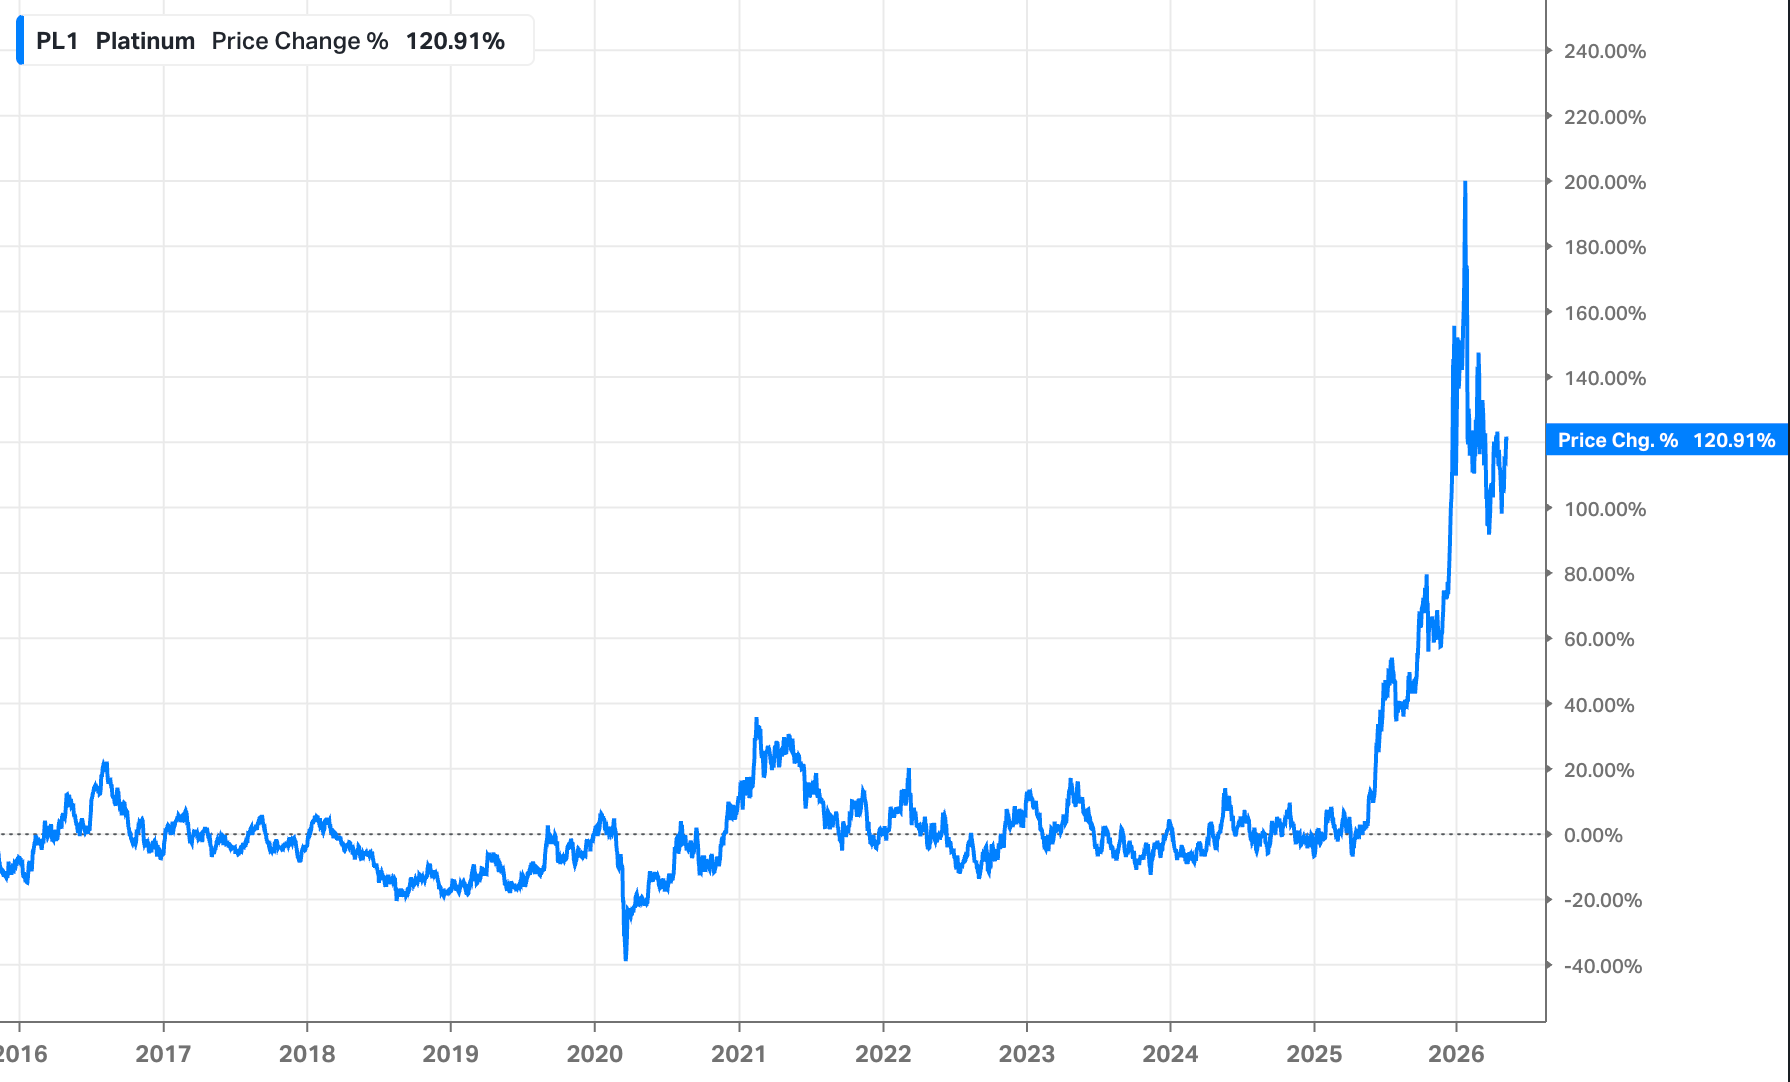
I’m a broken record on the importance of these coiled charting patterns, but first-hand experience over the years has reinforced that once they break, they break big (platinum is the clinic case study).
First, the S&P GSCI (formerly the Goldman Sachs Commodity Index) broke out, which is now being followed by the US 2-year Treasury yield. I wrote about it here in my last Ferg’s Radar in December 2025.

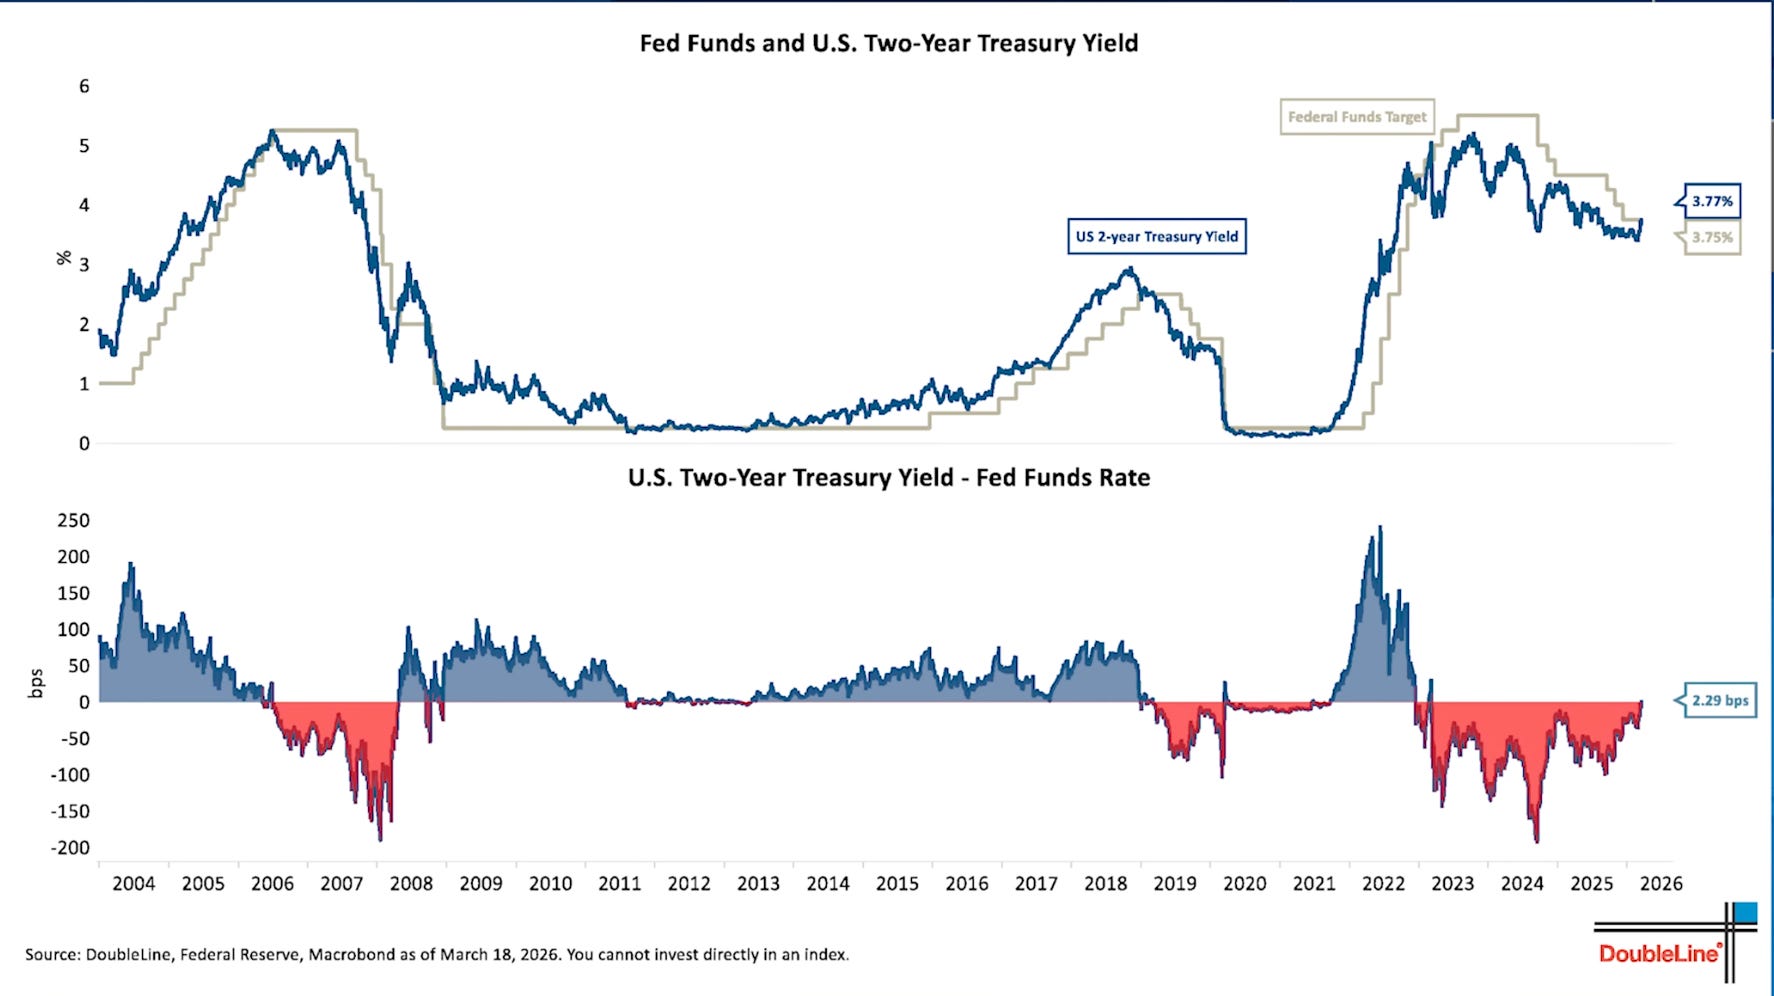
While the “hairy” chart is good for a laugh, a key insight from Gundlach is that the Fed’s Funds is simply the 2-year Treasury with a few months’ lag.
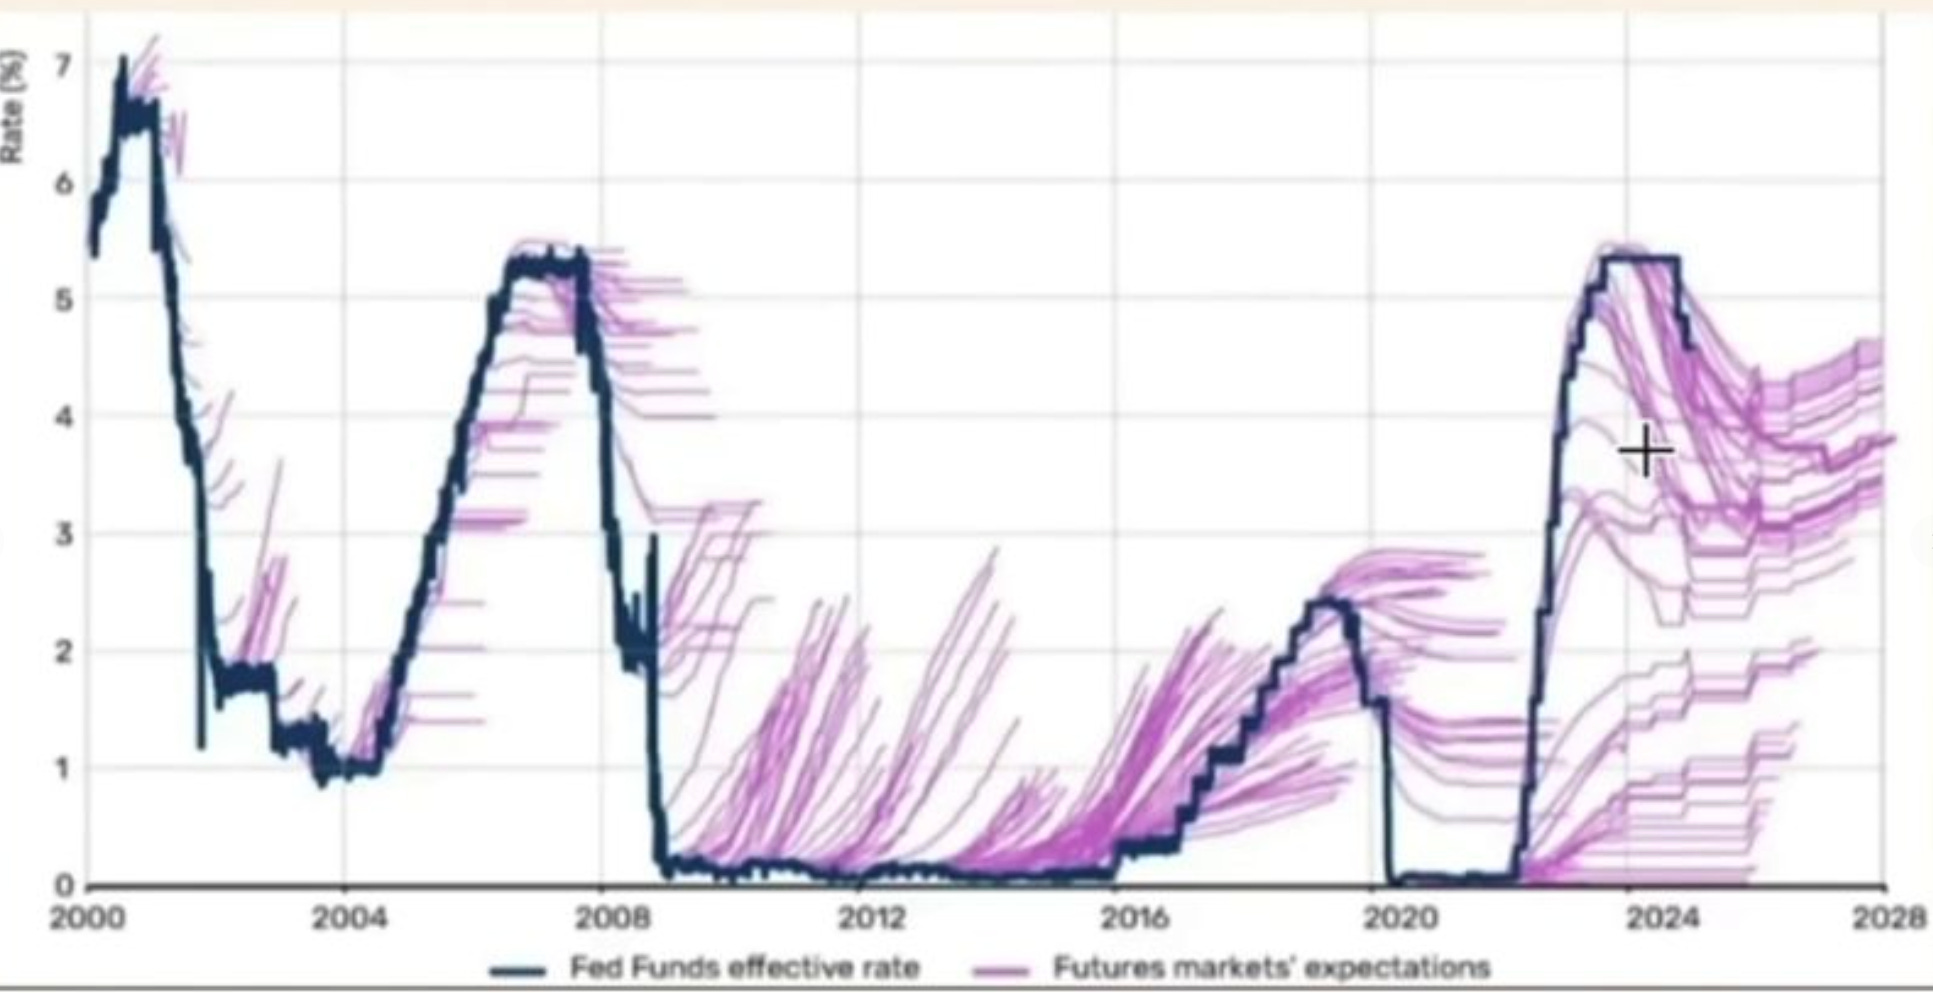
“I’ve said repeatedly that the 2-year Treasury is what determines the Fed funds rate, not the other way around. And I think we have a chart of the Fed funds rate and the 2-year Treasury yield simultaneously going back to 2004. And it’s very obvious that the Fed follows the 2-year.”
-Jeffrey Gundlach (We Don’t Know’ Signals Rising Fed Uncertainty)
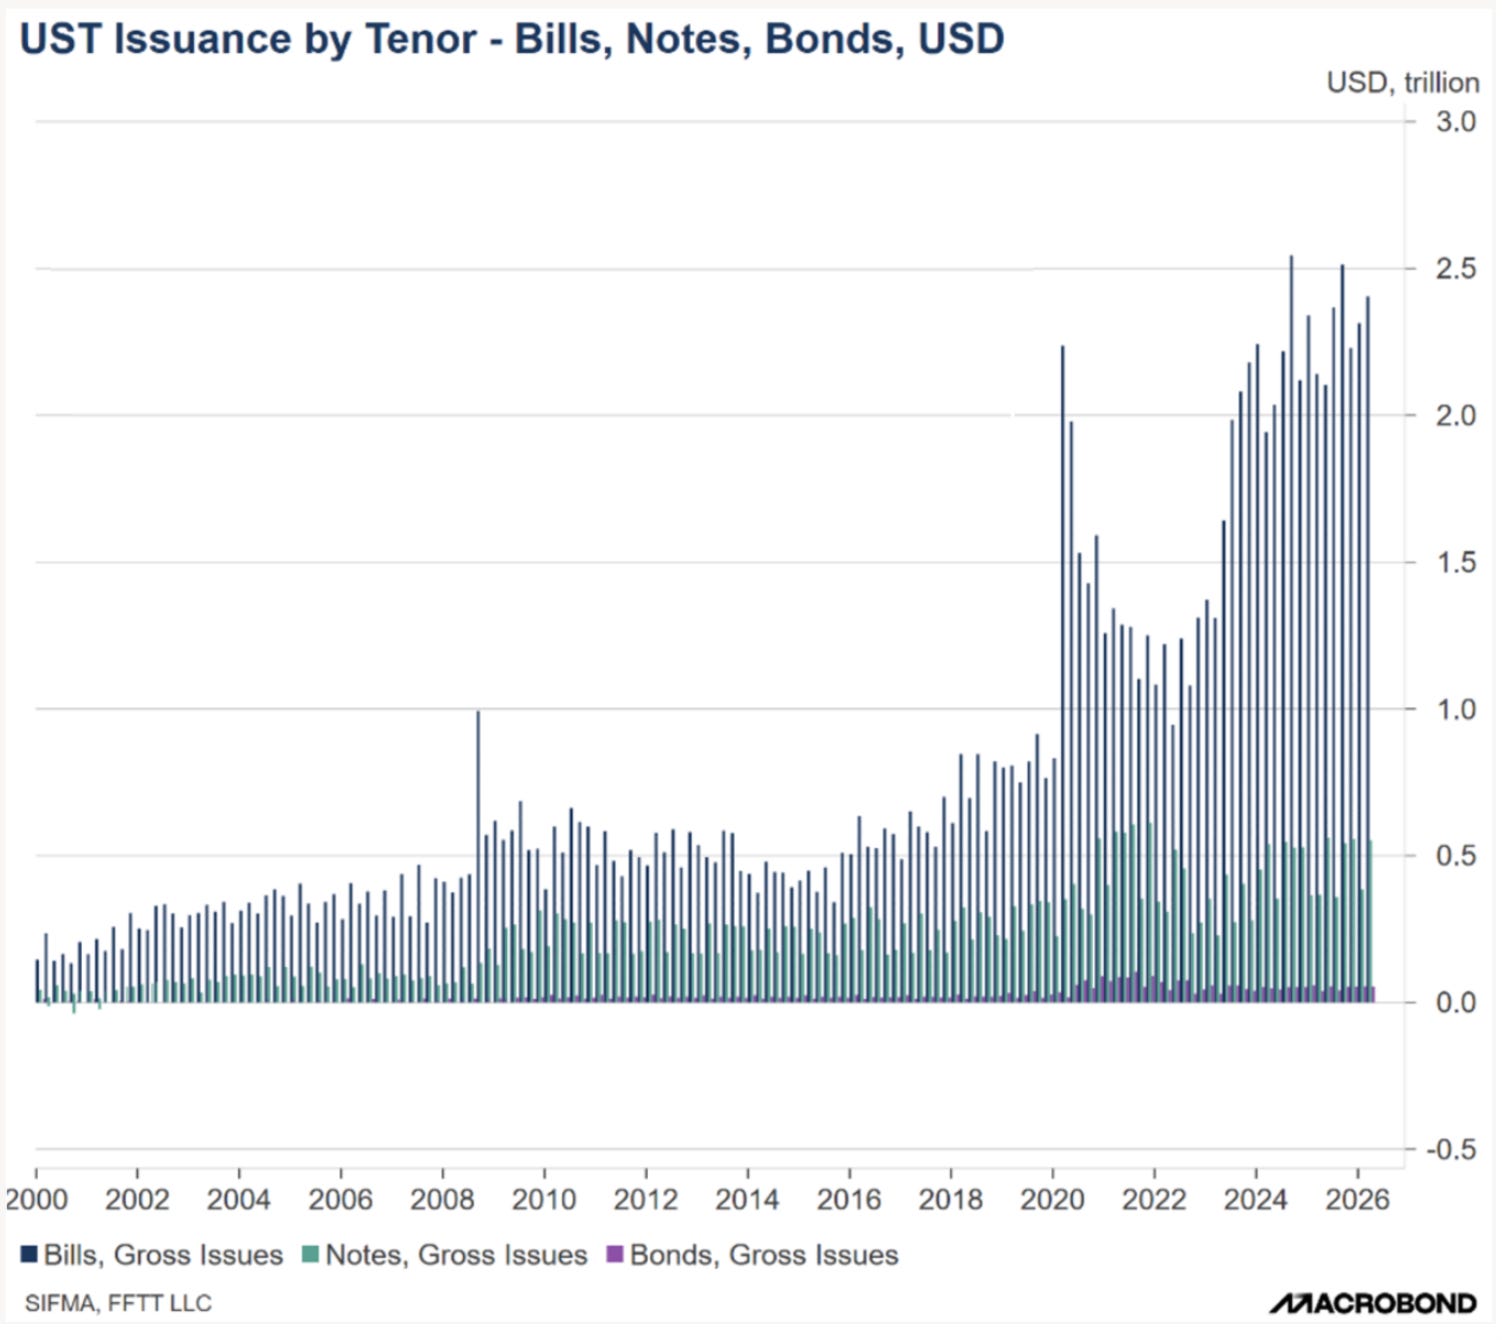
What makes this even nastier is that the US is funding itself with ever-increasing bills.
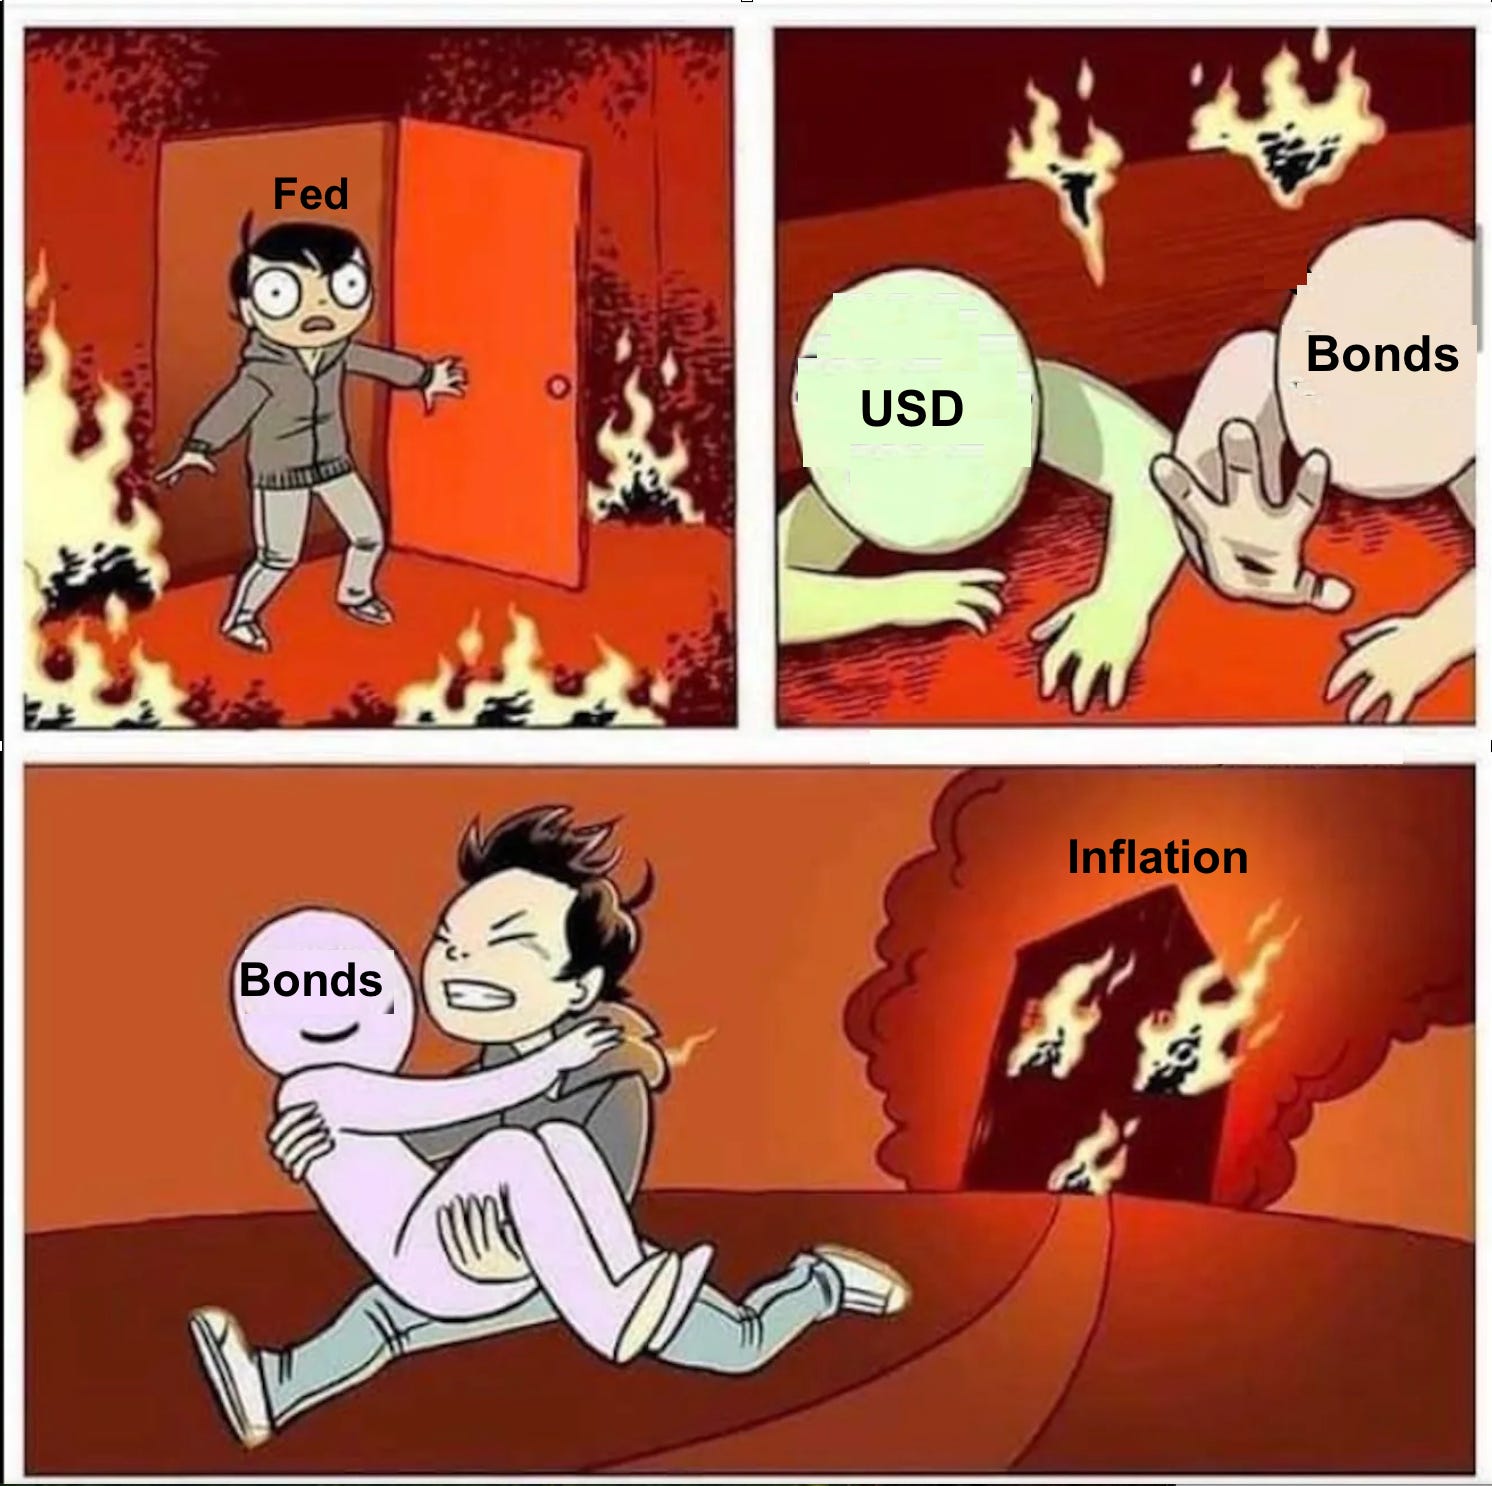
Takeaway? Inflation is coming down the pipeline, and the Fed is going to be forced to choose between saving bonds(nominally) or the USD. I’m positioned heavily for it to be the former, with the dollar continuing its slide.
Simply put, the inflation of the Iran war will soon force the US (and by extension, much of the West) to choose between “save the currency” (let bond yields rise sharply with inflation, i.e., bond prices FALL sharply), breaking everything but the USD and gold) or “save the bond market” (print USD to cap UST yields to maintain nominal US government solvency, turbocharging the already accelerating and soon-to-be problematic inflation).
-Luke Gromen
Or via meme.
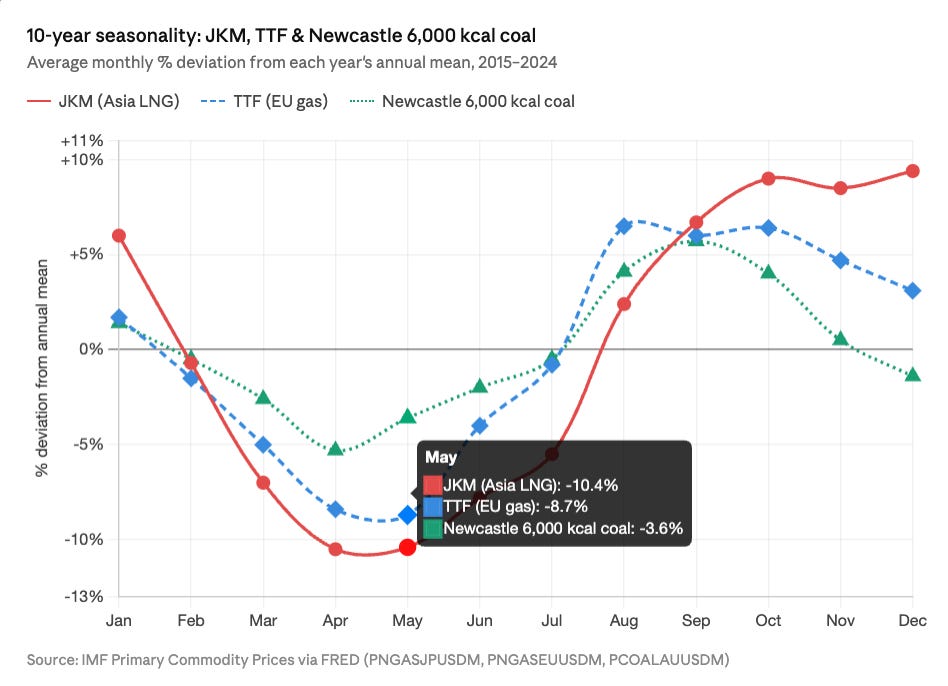
Seasonality LNG/Coal
Is the thermal coal thesis I outlined here still intact?
Well, first point: only two of Ras Laffans LNG trains have been restarted, so the full sequential restart, which takes six weeks, lands in July if full Hormuz transits are restarted, which they have not (bar two LNG carriers bound for Pakistan).
We are now starting the climb into Asian cooling, China has ceased reselling LNG cargos, and the EU will need to start outbidding flexible destination LNG cargos if it is to stand a chance of reaching adequate storage ready for winter.
The bigger surprise was just how heavily China cut its LNG demand, drawing on inventories, pipeline gas and gas-to-coal switching flexibility.
China’s April LNG Imports Set to Hit Eight-Year Low, Kpler Says
China’s LNG imports plunge, helping Asia adjust to Iran war losses
China re-selling its flexible LNG cargos, combined with storage drawdowns and ramping coal utilisation, helped paper over the loss of Qatar LNG (the likes of Pakistan and Bangladesh got priced out, and Taiwan refused the “energy for reunification” offer).
Granted, this was a short-term reprieve with China’s reselling drying up in April, and they are now looking to step up purchases in June-July (China resold 720 kt in March 2026, which then dropped to a single 30 kt cargo in April as Chinese storage drew down to 43%).
China’s continued LNG inventory drawdowns in April shift spot LNG demand upside to early Q3
This dynamic is delaying rather than eliminating LNG demand, pushing restocking into early Q3. As inventories fall below seasonal norms ahead of peak summer, China’s supply buffer is tightening, particularly in southern regions where hydropower risks and stronger cooling demand are emerging. We expect a step-up in spot LNG procurement from June–July, creating a bullish skew to Asian LNG prices in early Q3, with upside risks amplified if supply disruptions persist.
Looking right out the curve, JKM is trading at a premium to TTF, so Asia will continue claiming destination flexible cargos as the EU refuses to pay up for spot cargos for now.
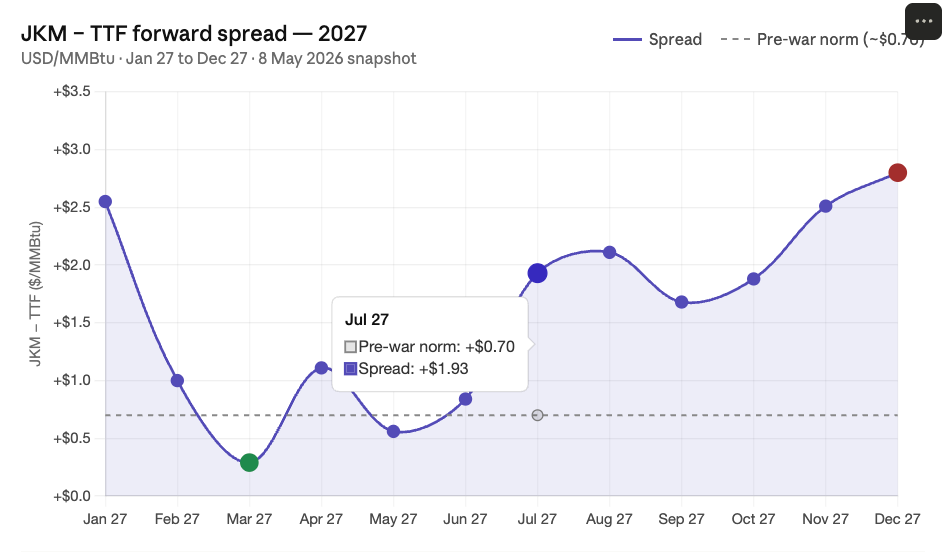
There is a point where EU companies will be forced into the market by necessity if they are to stand a chance of hitting the bottom end of storage levels.
The current summer season is expected to see higher fuel prices due to intensified competition for available LNG volumes on the market with Asia, driven in part by the escalation of the Middle East conflict. Earlier, Gazprom projected that European gas storage levels may fail to even reach 70% ahead of the next heating season.
-European gas storage levels rise above 30% as injection pace accelerates
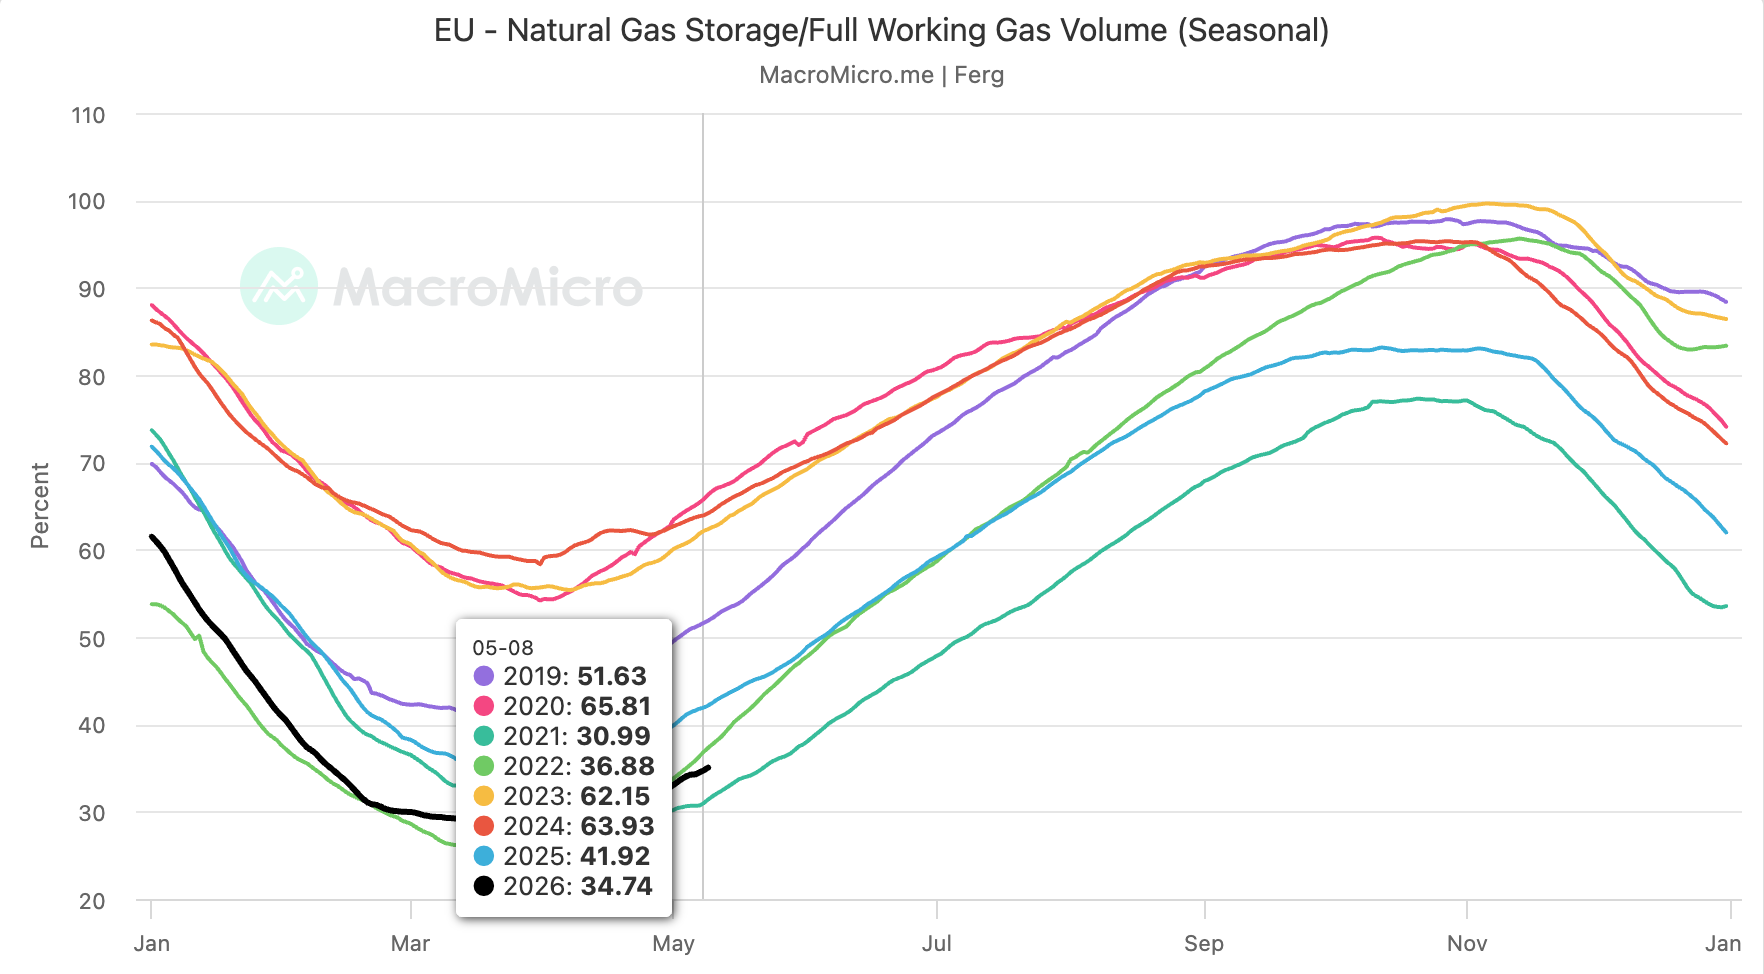
While 2022 was more acute, EU prices did mean-revert from the initial spike for a period, and Asia had its Qatar fixed-destination contracts, so there wasn’t the potential bidding-war dynamic we have now.
I continue to like seaborne thermal coal here and see it catching a bid via gas-to-coal switching in June/July as Asia fights for destination-flexible LNG for its cooling demand, while the EU will have to pay up if it is to secure sufficient LNG for storage.
While I’m on this point, I’ll throw in an extra variable which potentially supercharges the above dynamic.
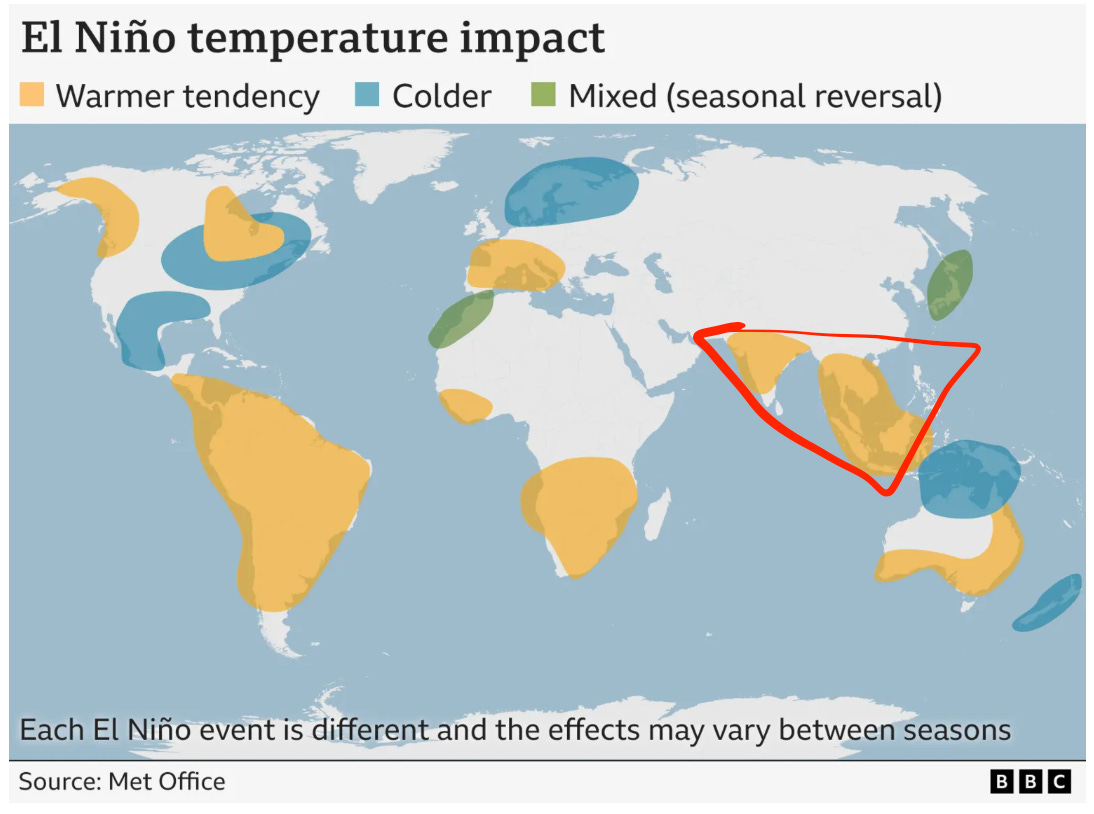
Super EL Nino?
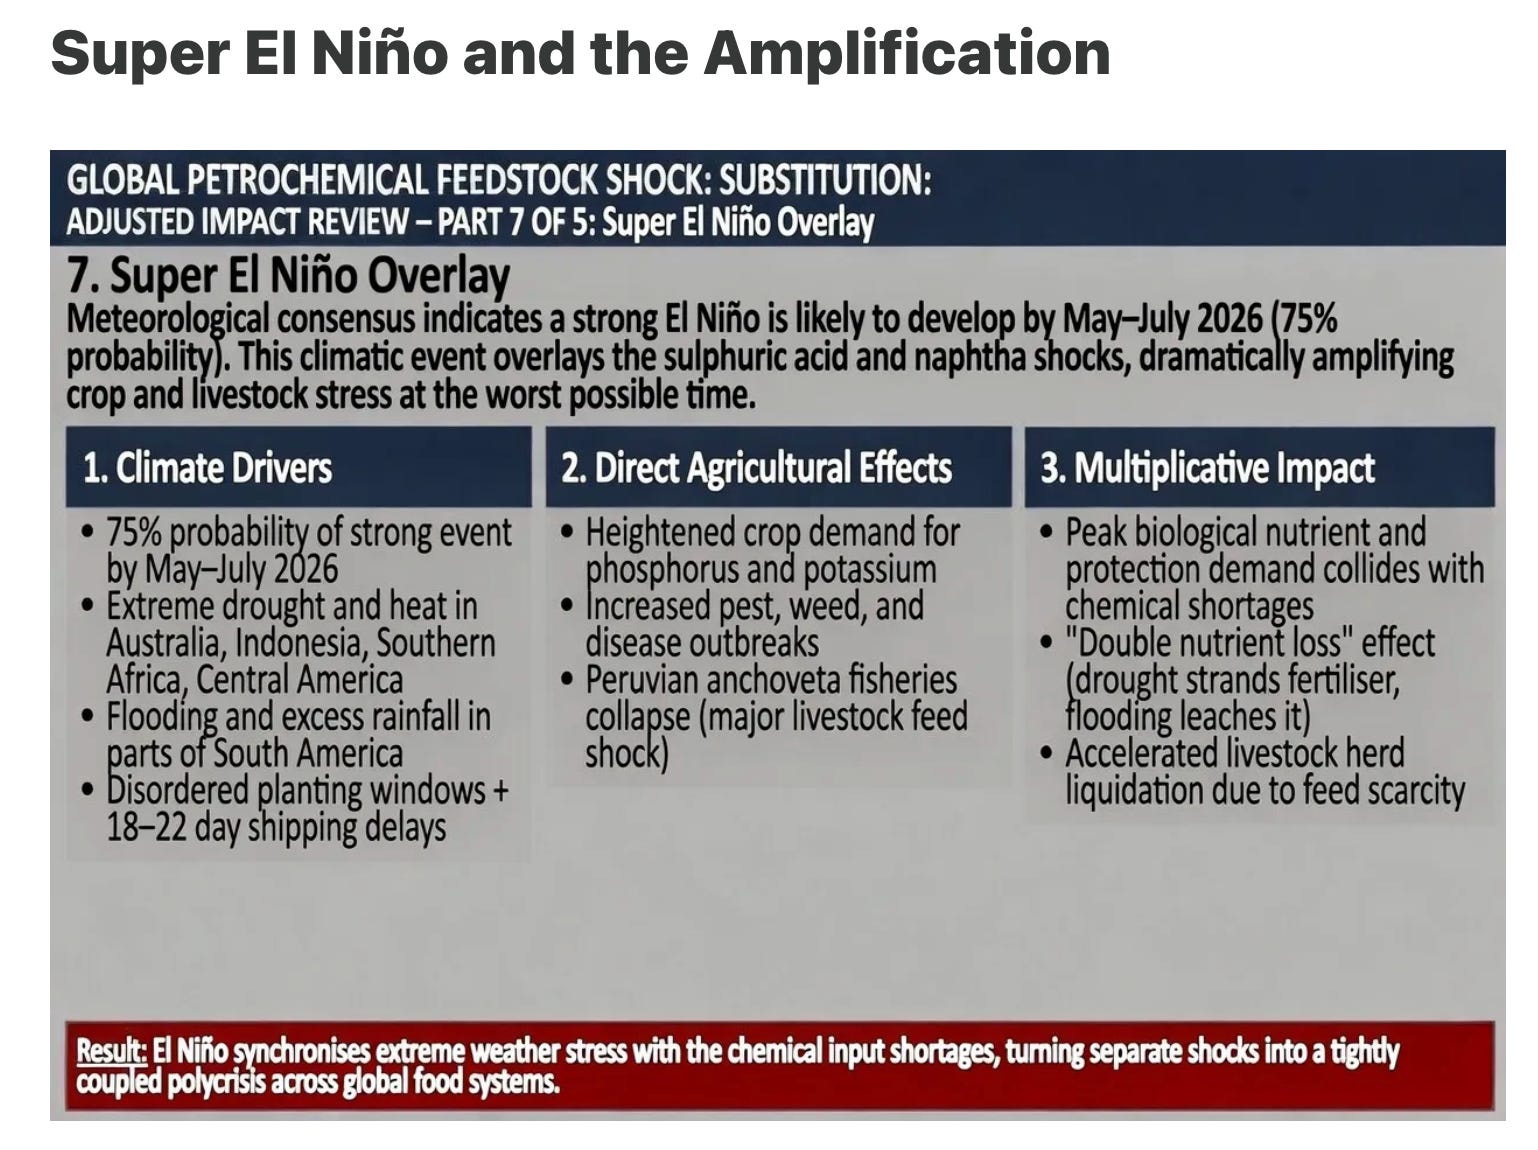
Craig Tindale sees a 75% probability of a strong event in May-July 2026.
As a rule, I avoid positioning around anything weather-related. Granted, if it’s a “free upside call” on a theme I already like, I’ll take it!
A third of the world lives in the affected triangle (conservatively, if we include Southern China, the percentage can reach the low forties of the global population).
Being long thermal coal and agriculture (wheat, corn, and sugar) seems like the best way to hedge/position against some of the shocks Craig is outlining.
The Four Horsemen of the PolyCrisis: Sulphur, Naphtha, El Niño & Central Bank Amplification
Uranium ISR
I find the parallel between fracking and ISR mining interesting, in that both are “just in time” production in comparison to conventional mines and long-cycle offshore oil projects. Yet with the steep production ramp comes equally steep decline curves.
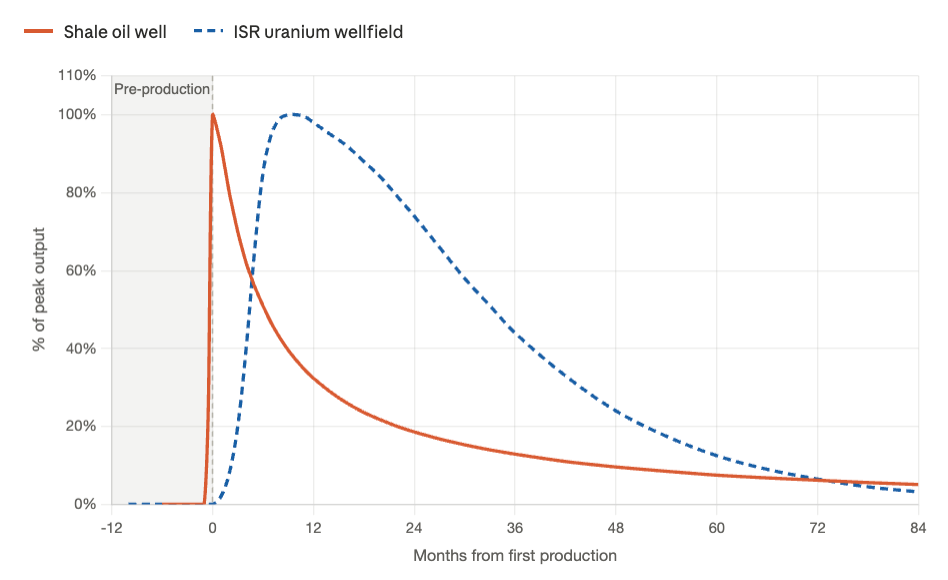
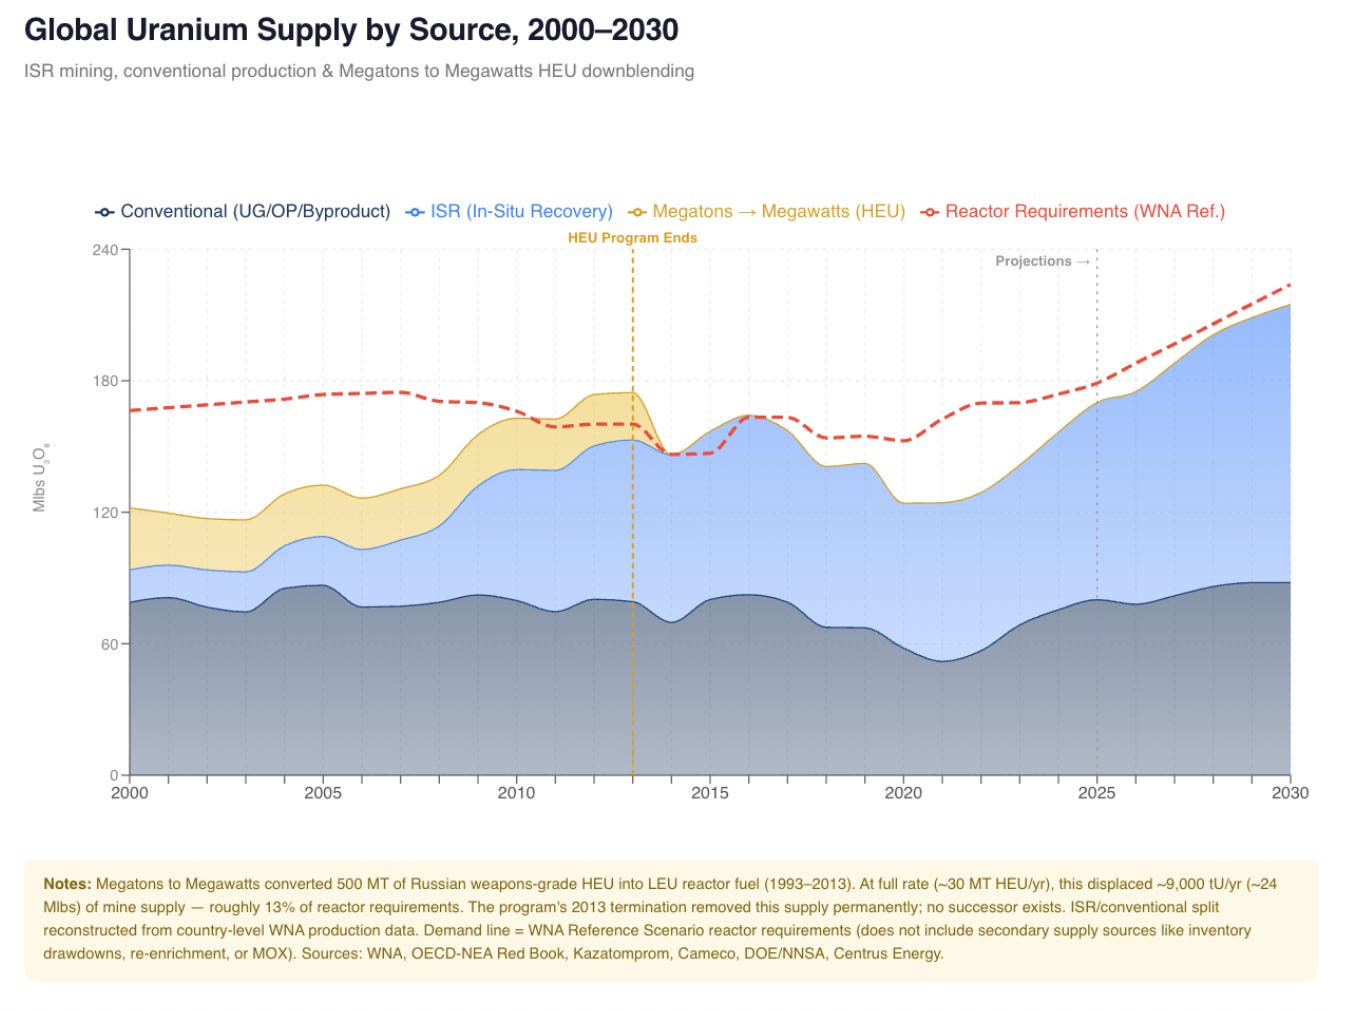
Depending on which source you use, most uranium forecasts have ISR ramping from 55% today to two-thirds by 2030 (not to mention Megatons to Megawatts isn’t going to save the day this time).
I highlight this as the trajectory of current ISR mines isn’t exactly promising, having learned first-hand from owning Boss Energy for a period (and all the heartache that went with it).
While some of these names have been solid performers, none have been solid producers, which matters as the supply deficit continues to grow. Not to mention the sulphuric acid shortages heavily impact ISR: Why Sulphuric Acid Commands the Upstream Chokepoint of Civilisation.
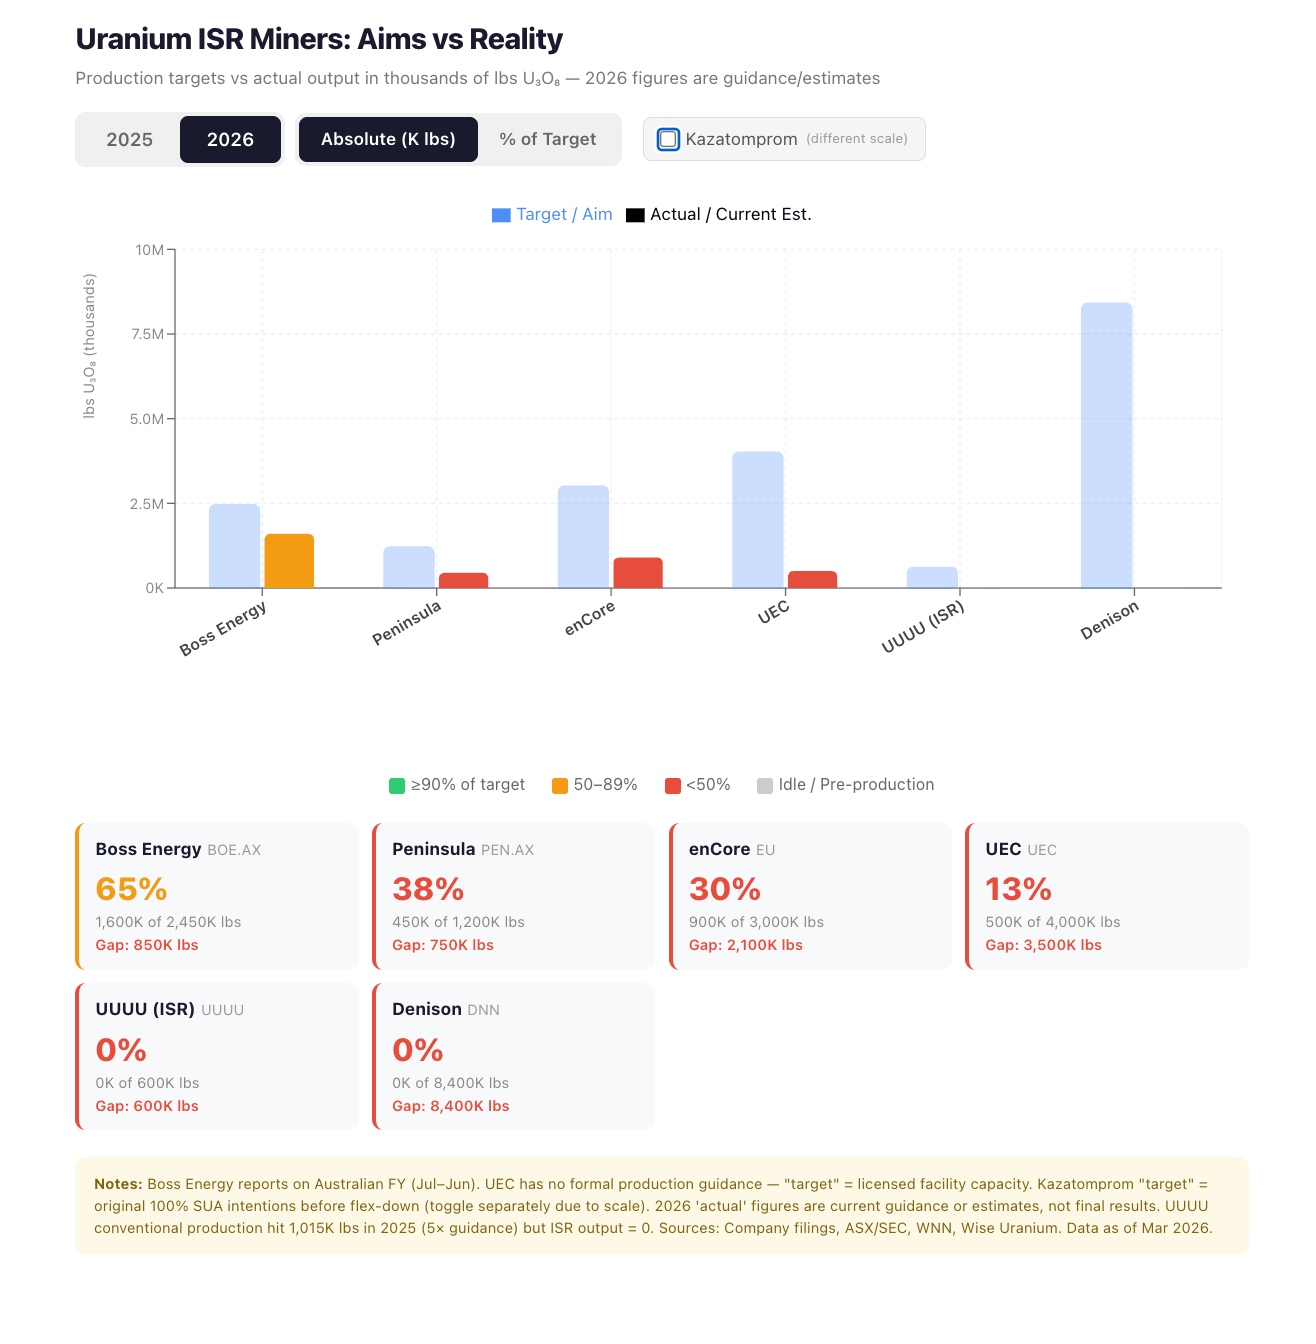
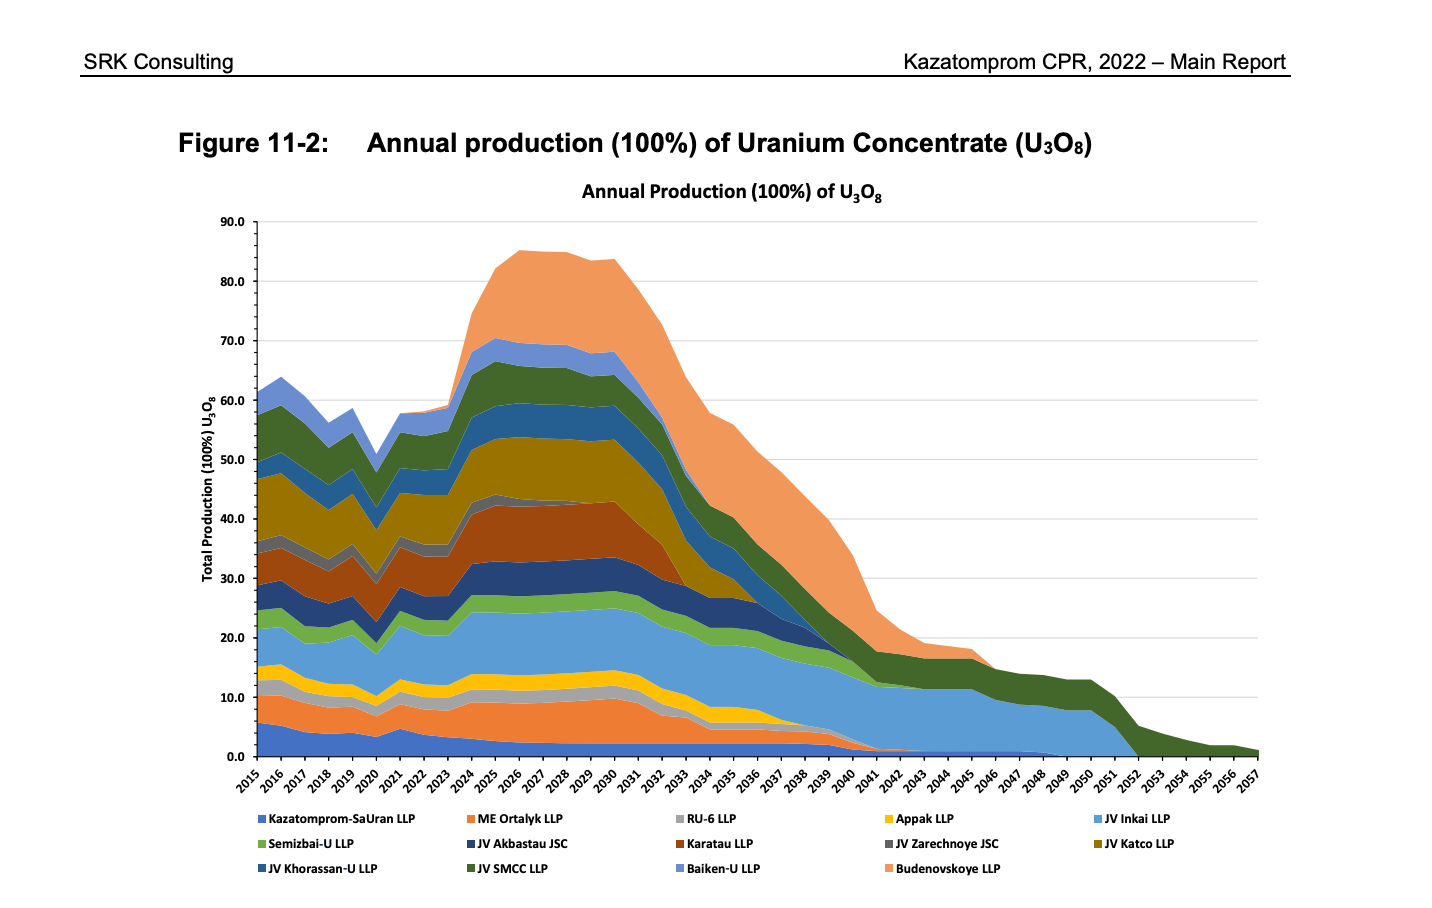
All of the above ISR projects are rounding errors compared to Kazatomprom’s impact, and this announcement has massive long-term implications.
Kazatomprom Announces Amendments to the Subsoil Use Code (29 December 2025)
“De facto nationalisation of the uranium industry in Kazakhstan”
Priority exploration rights for Kazatomprom (This closes the door on third-party discoveries translating into production rights).
New SUAs require >75% Kazatomprom ownership for transfers. These new requirements apply exclusively to new SUAs and do not affect existing SUAs.
Extensions and production increases require 90% Kazatomprom stake or tech transfer. Extensions or increased production volumes on existing SUAs necessitate a 90% Kazatomprom ownership stake or the transfer of conversion and enrichment technologies (which Western simply can’t do, so will see their stakes diluted to ~10%).
Expanded grounds for early termination and ring-fenced incremental reserves. Grounds for early termination of SUAs now include full depletion/development of uranium reserves as of 1 January 2024, and failure to meet obligations regarding the National Company’s ownership increase or the transfer of conversion/enrichment technologies.
While this was announced in 2024, it was enacted this year: Kazakhstan’s Surprise Tax Increase Shakes Up Global Uranium Market.
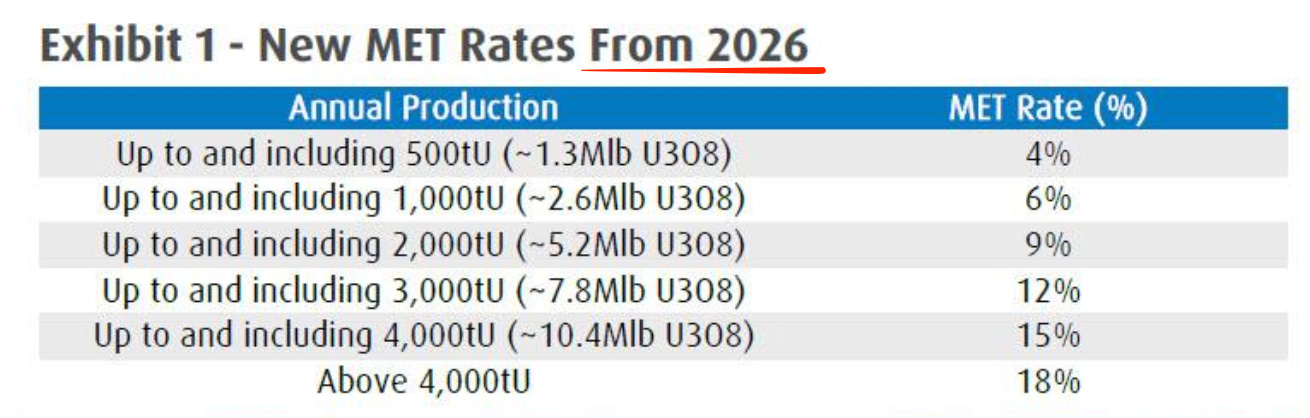
All of the above just reinforces that the Kazahs have shifted from a volume to price-focused strategy, and with the declines below facing Kazah production in the 2030s, I remain a bull on the sector and physical in particular.
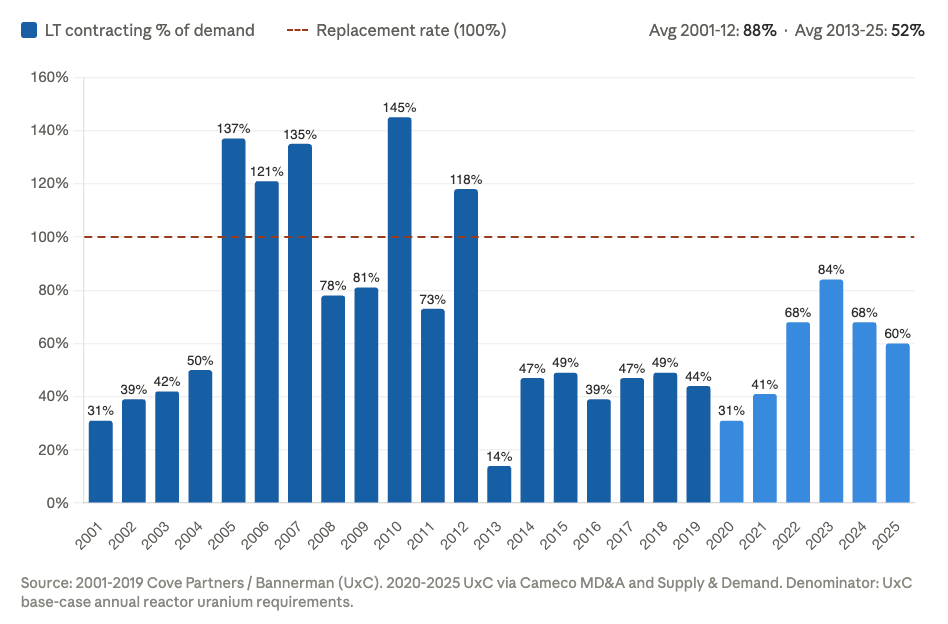
While it’s taking an awful lot longer than I first expected, the closure of the Hormuz Strait is bringing attention to energy security, and I fully expect a repeat of 2005 to 2010, when nuclear utilities contracted well in excess of their replacement rate.
PGMs
I was always drawn to the PGM sector because I’m lazy, and four companies account for ~90% of global supply. So all I needed to do was keep up with these four companies’ earnings and have perplexity tasks update me with any important announcements, and boy was this announcement a whooper: Russia’s Nornickel Reports Sharp First Quarter Drop in Metal Output (28th April 2026).
Platinum production fell 26% compared with the same period a year earlier, while palladium output slipped by 18%, copper 10% and nickel 0.3%.
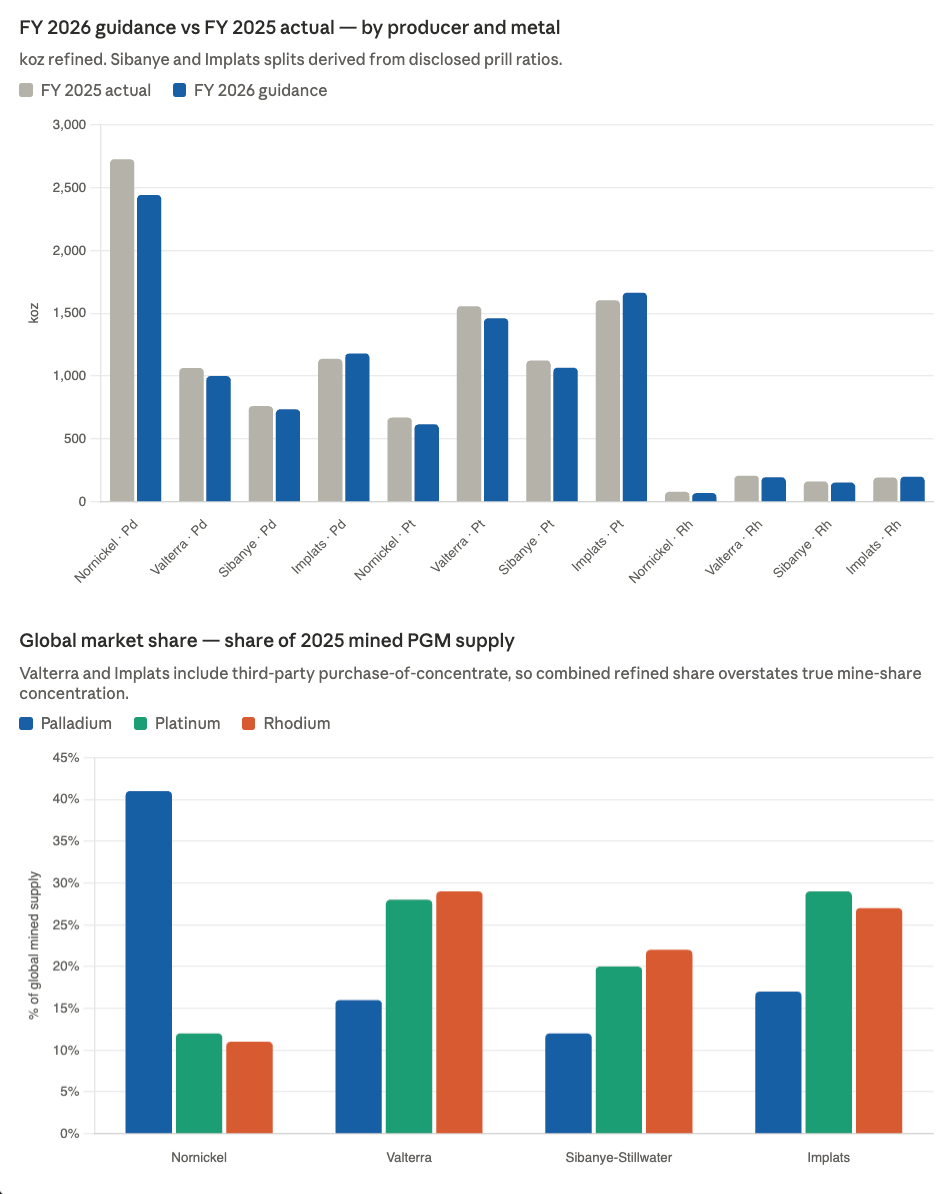
Despite higher prices, the majority of the PGM sector is guiding lower.
Nornickel really matters as it was where the PGM growth was going to come from in the 2026 -2030 timeline. The whole Talnakh expansion package (TOF-3 + South Cluster + Medvezhy Ruchey) is intended to add roughly 5–6% to global primary PGM supply, but has slipped by about 5 years: originally targeted for 2023 commissioning.
Nornickel has solved all import substitution issues and is essentially ready to continue the project. The estimated completion date is 2028.
-Sergei Dubovitsky (Nornickel Senior Vice President)
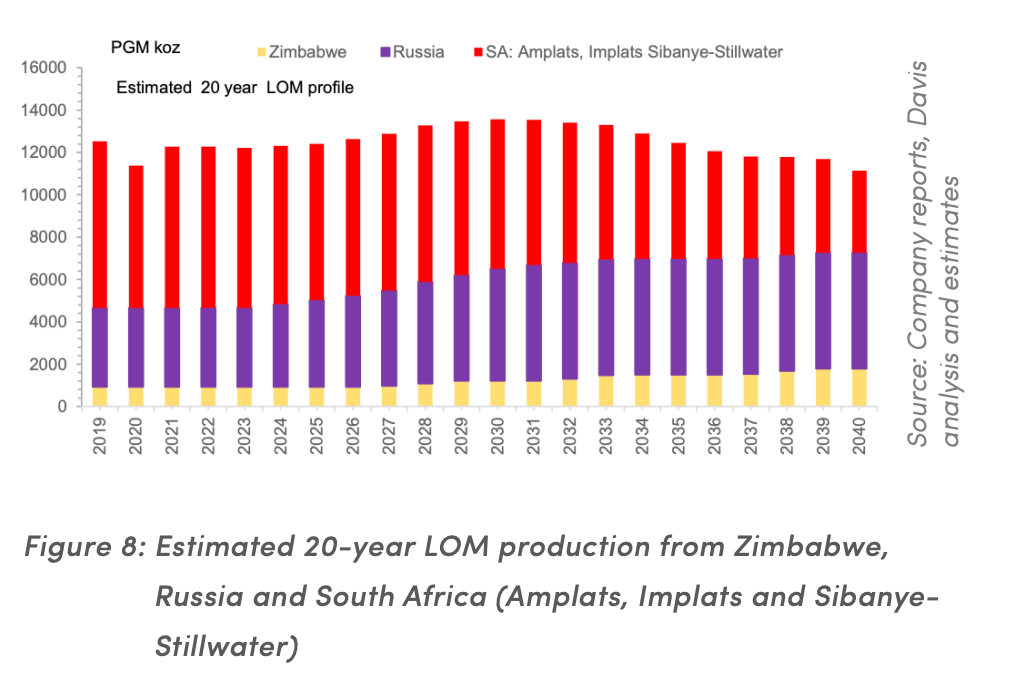
South African supply isn’t coming to the rescue, as I’ve spilled pages of digital ink on!
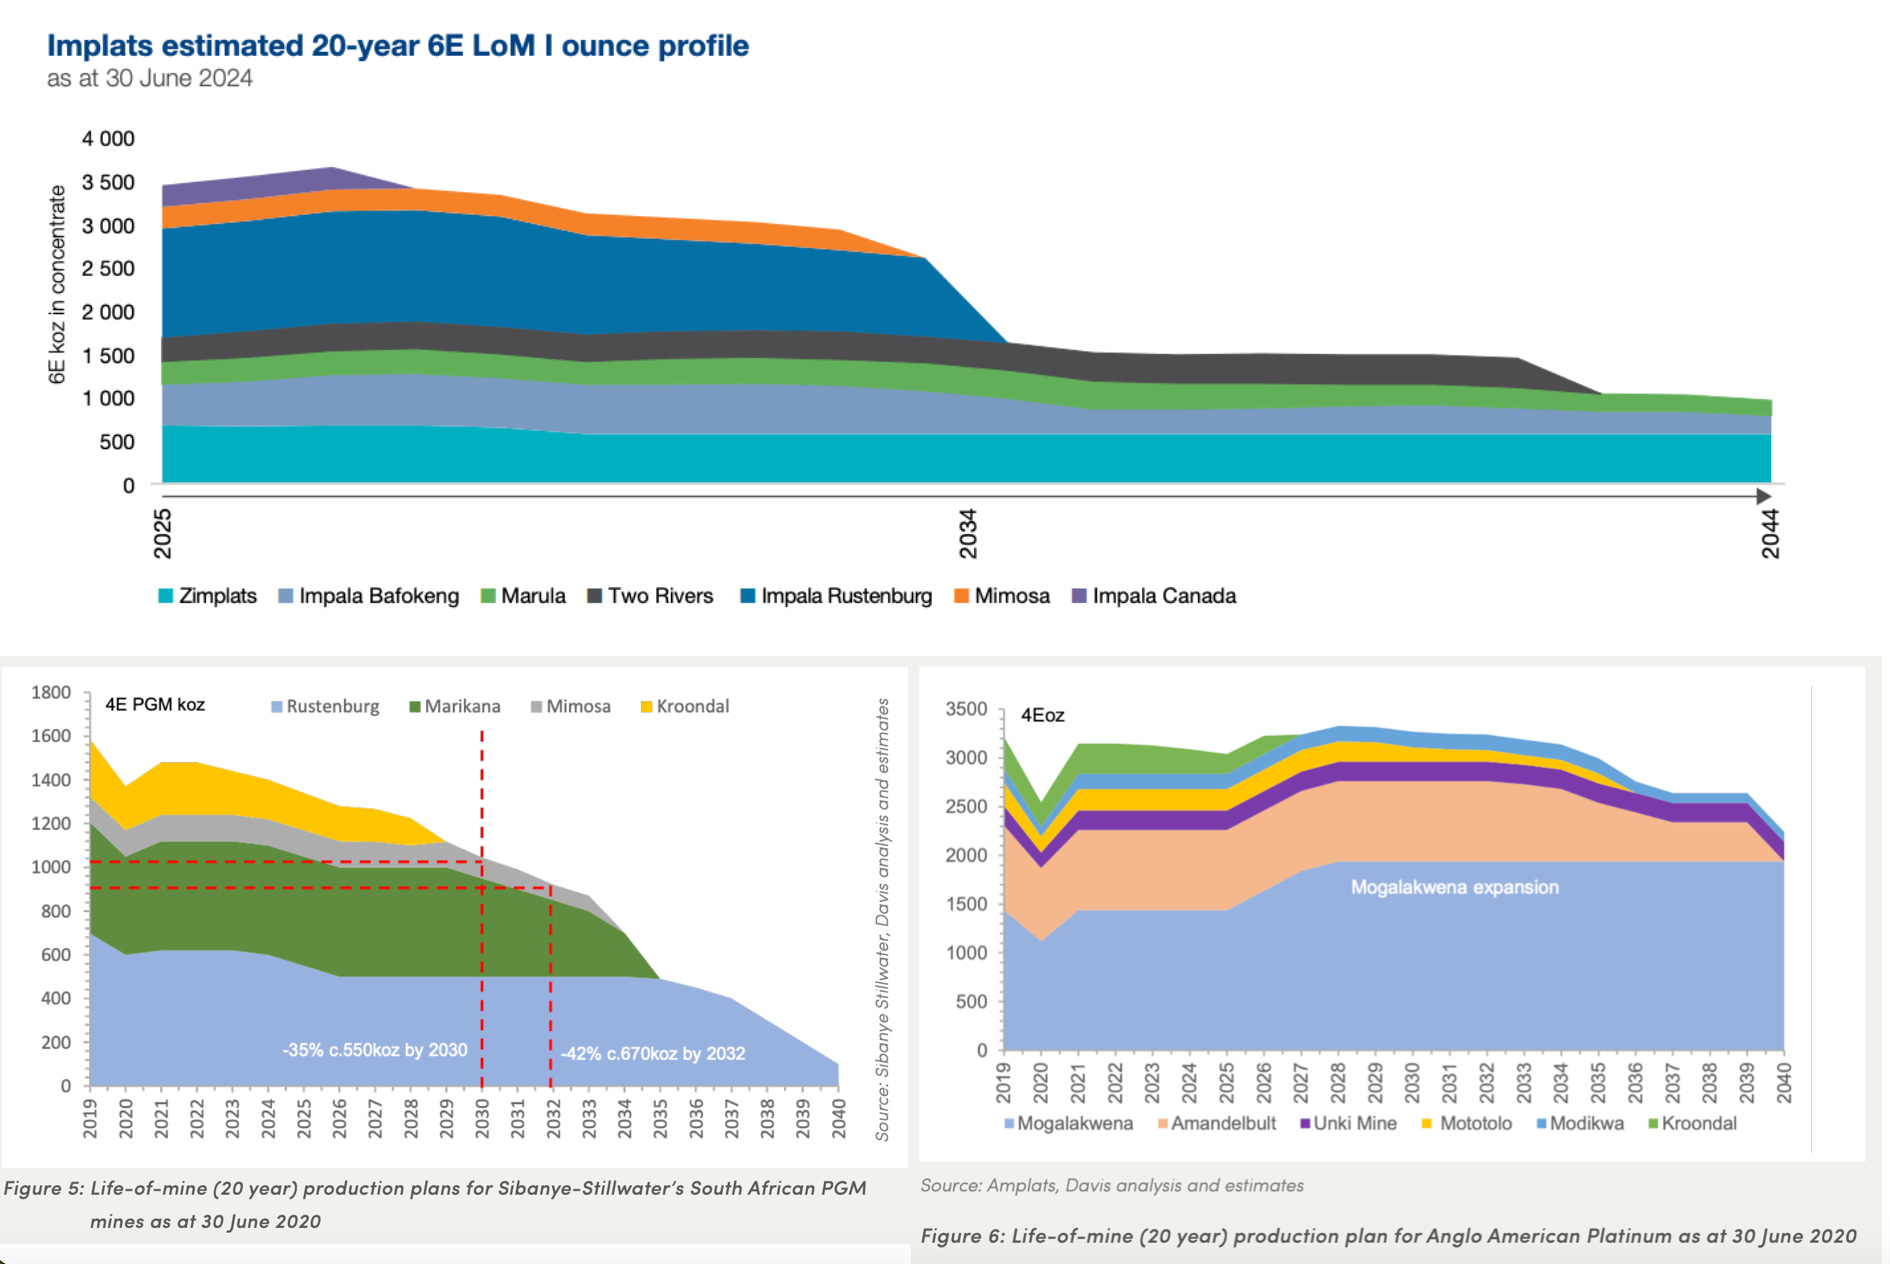
Takeaway is similar to uranium in I remain very long physical and Valterra.
JOMO Markets
You have FOMO markets (Fear of missing out), where it’s a pile-on of performance chasing.
JOMO is the opposite (joy of missing out), where there is a sigh of relief when you mention the sector because the collective experience has been that bad.
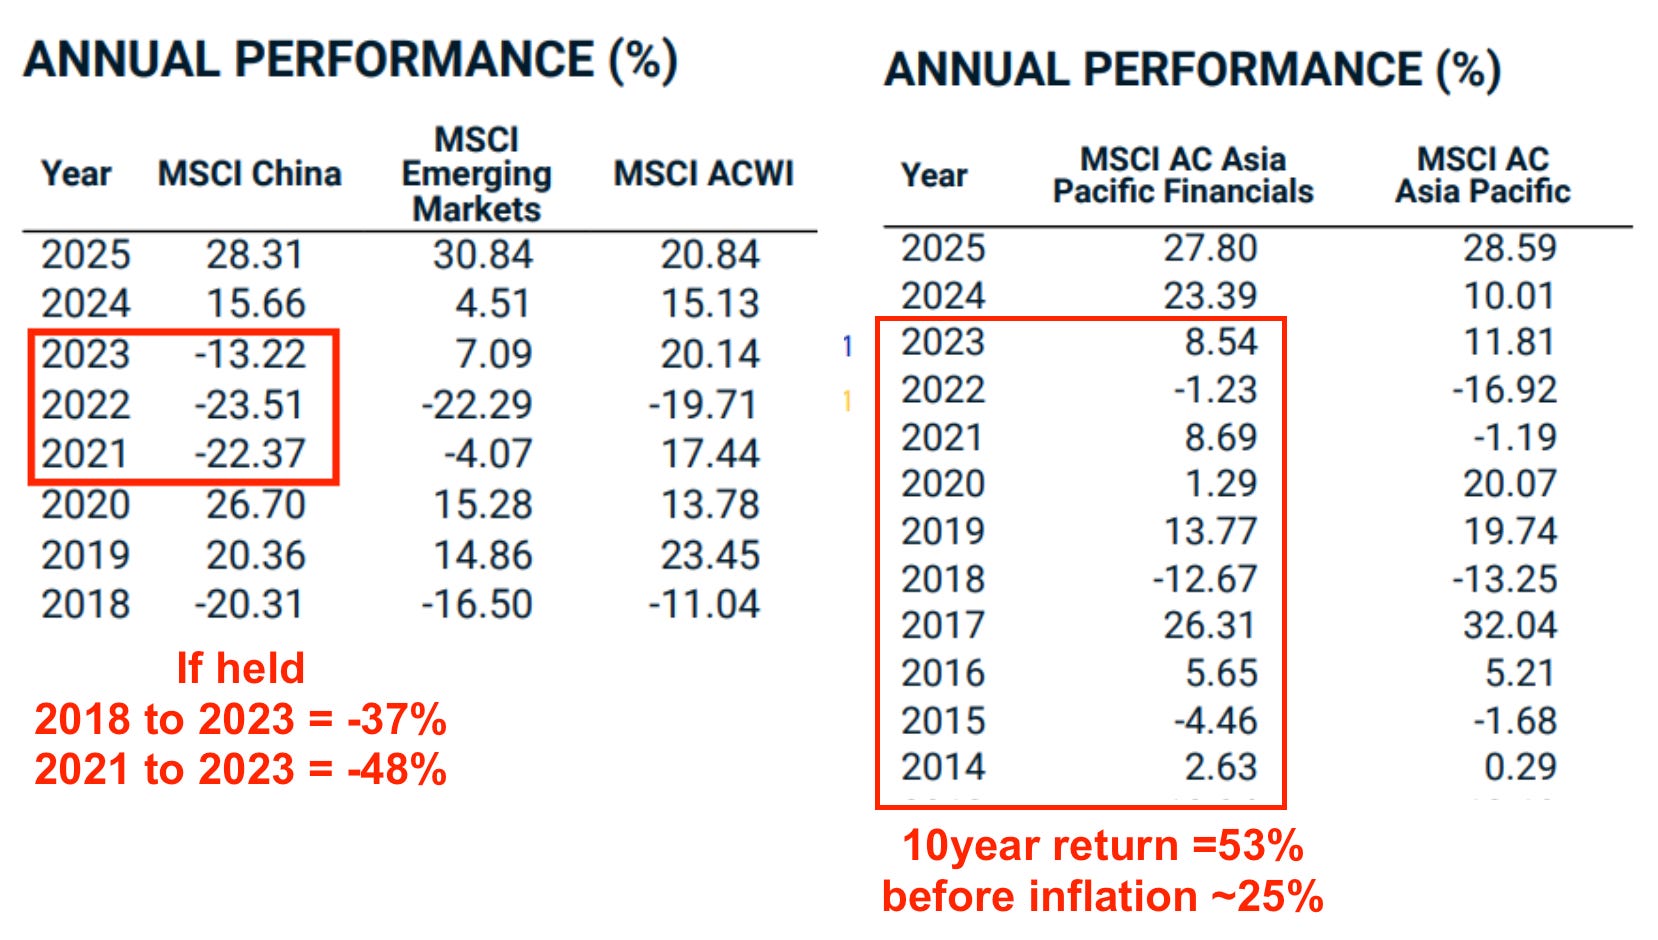
Investing in Chinese large caps and Asian financials was certainly JOMO up until 2024.

I get why investors are cautious, as the MSCI China performance above shows a history of a year or two of outperformance, and then a rug pull.
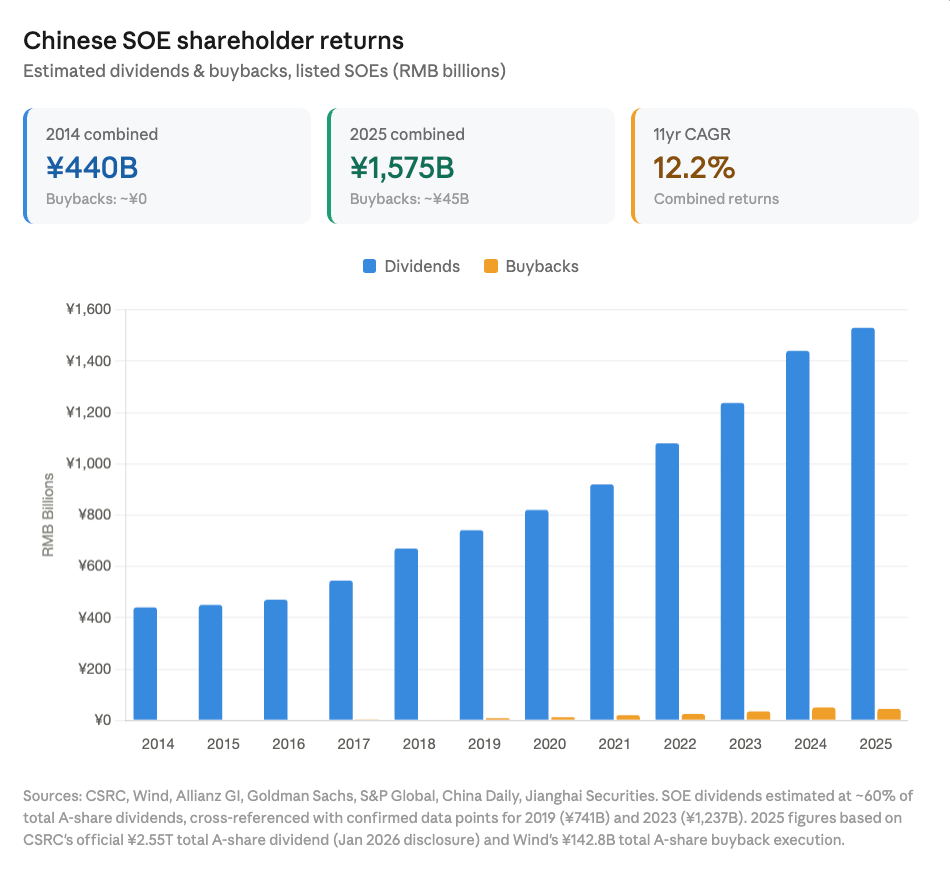
I’m going to dig into this in more detail in my next piece ‘Hugos Portfolio’, but a simple outline of what I’m creating is using EM exchange operators and EM banks to create a torqued EM index (60%), and the other 40% is boring infrastructure-heavy energy, chemicals, agri, utilities, which spit out dividends and trade at a fraction of their replacement cost.
Essentially, getting long the chart below, where recent regulatory changes are whipping SOEs to increase shareholder returns from dirt-cheap valuations (some have deeply negative enterprise values).