

My track record of calling geopolitical events is unblemished by success. So I’ll save you some geopolitical astrology on the probability of a resolution vs. a drawn-out regional crisis and go with a 50/50 probability.

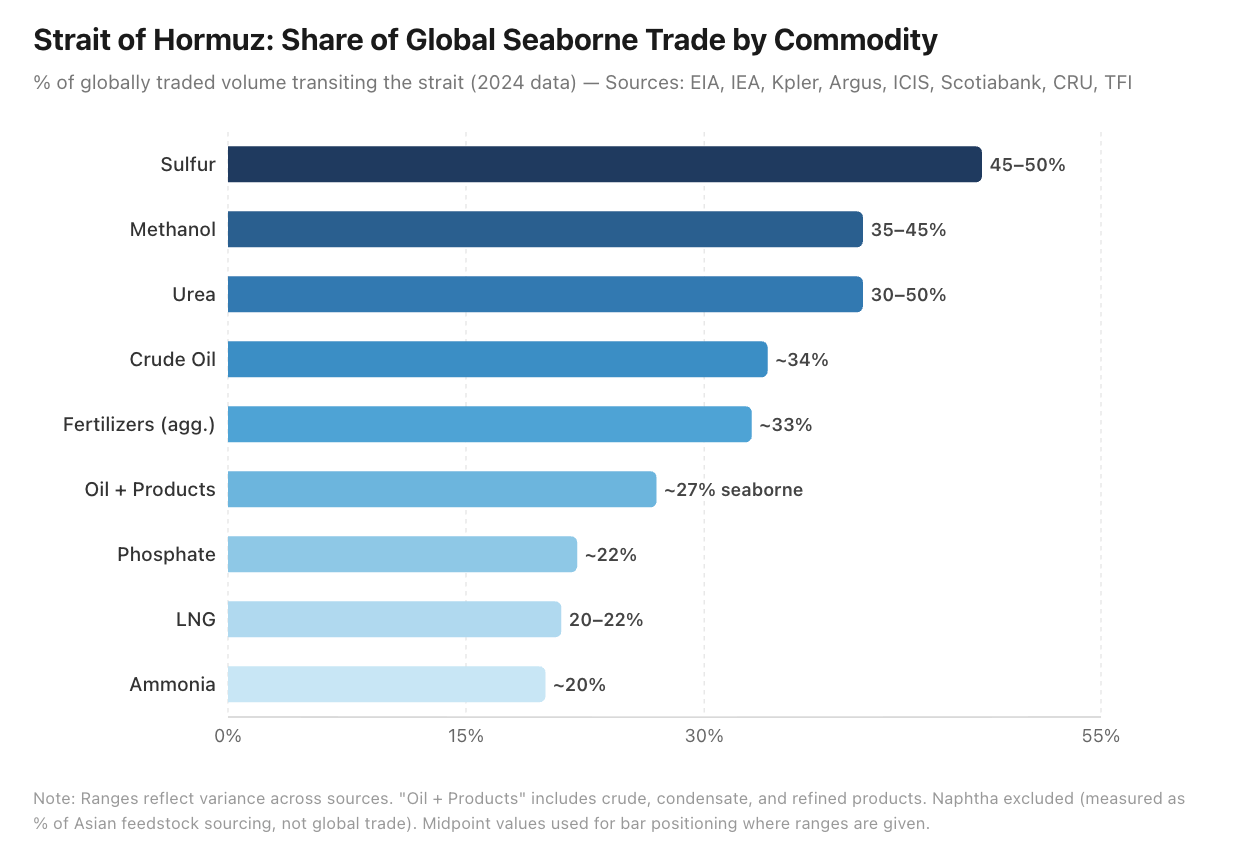
Dealing with a 50% probability makes you dial in your risk vs reward and sizing if the outcome is a coin flip. A chain reaction across multiple commodities is underway, given the share that passes through the Hormuz Strait, and we are about to see all sorts of spikes and craters across the markets.
TACOs are off the menu
Unlike tariffs and trade negotiations, Trump can’t simply TACO here as shit gets out of hand. It’s becoming increasingly clear that there is no plan B, and Iran now holds the leverage via Hormuz.

There is a clock ticking on how long this war goes on before dwindling munitions stockpiles start causing US casualties as they fail to intercept Iranian drones and missiles?
Remember this last year: US used about a quarter of its high-end missile interceptors in Israel-Iran war, exposing a supply gap 31/07/2025
It’s no secret, as recent headlines highlight.
U.S. Races to Accomplish Iran Mission Before Munitions Run Out (1/3/2026)
Iran’s Missile Barrage Tests Whether US Has Enough Interceptors (1//3/2026)
The US fired about 150 THAAD interceptors last June to defend Israel during the 12-day war against Iran, according to the Center for Strategic and International Studies. Those weapons are the highest-end ground-based missile defense system in the American inventory, with each Lockheed Martin Corp interceptor costing about $15 million.
While the cost asymmetry is crazy, considering $15m interceptors are being used to take out Shahed-136 drones, which cost an estimated $20-50k per unit. Cost is not the issue; it’s critical minerals without which you can’t make a THAAD or pretty much any high-end military munitions.
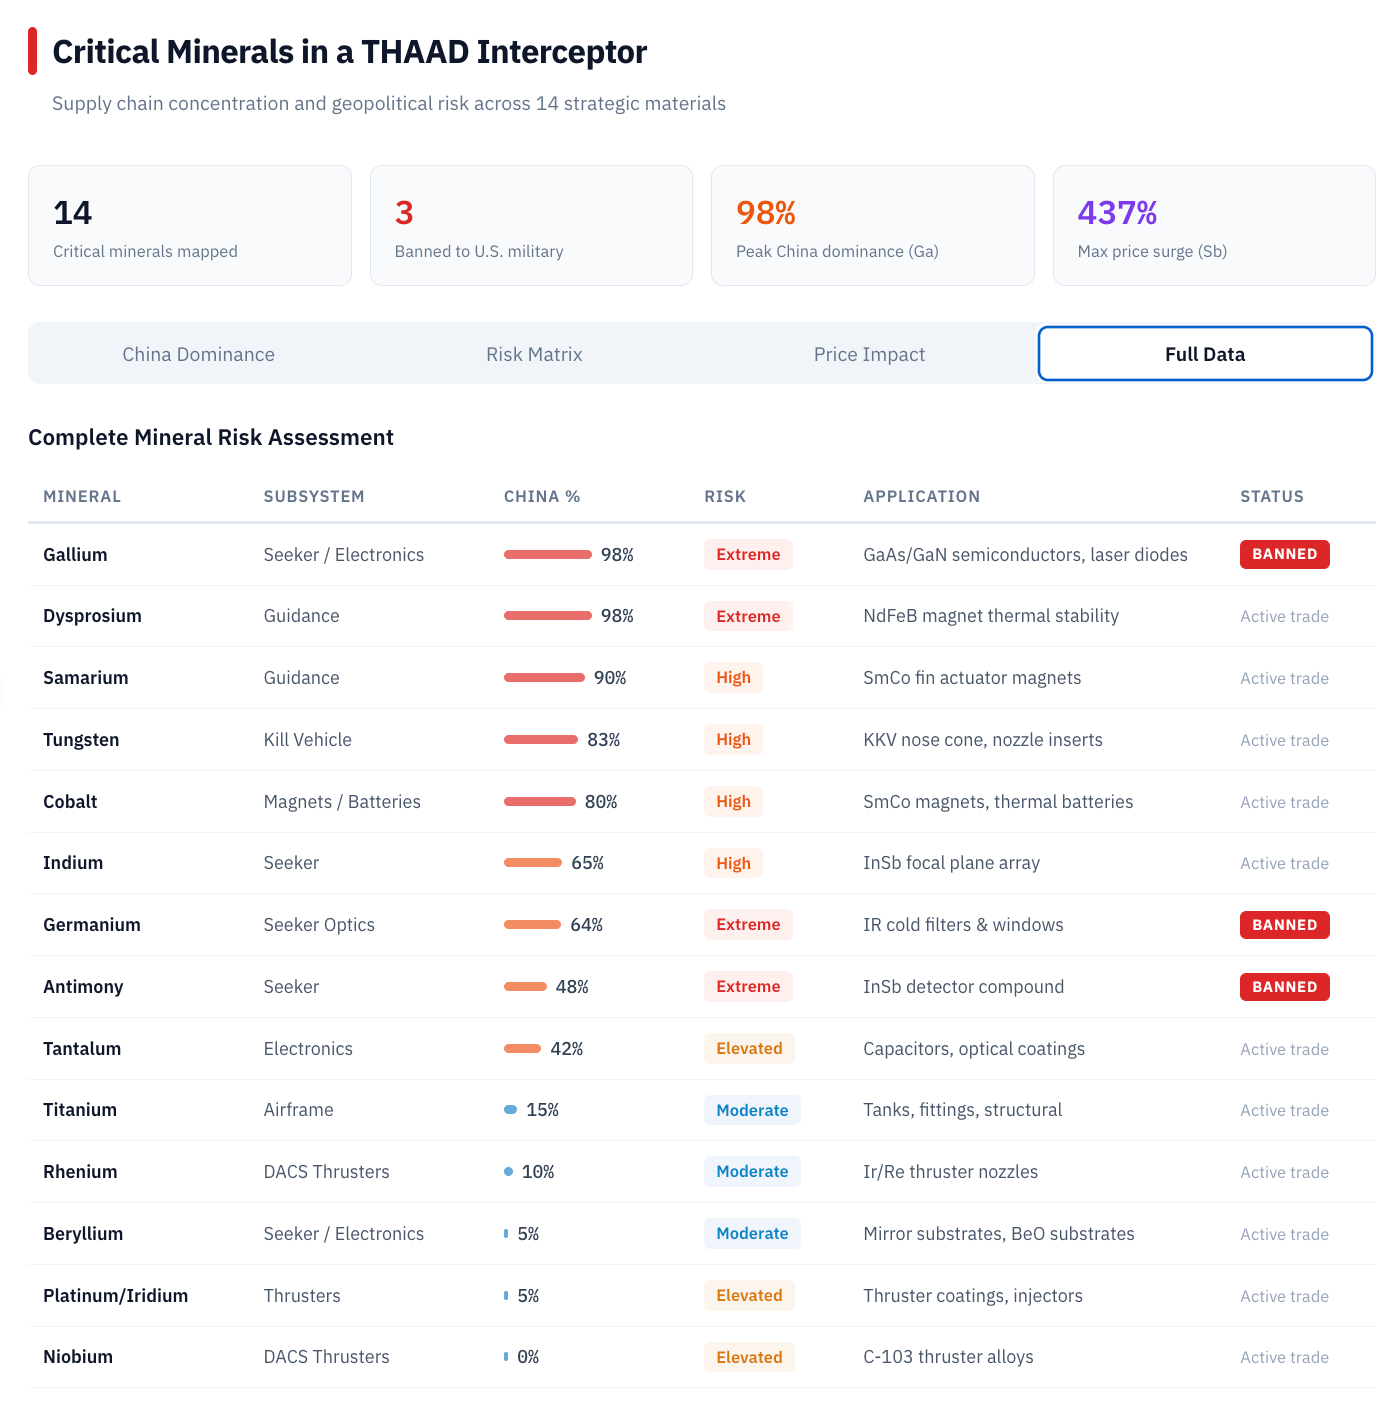
It’s this chart, over and over again: China controls a few key pinch points, which it can ban, limit, or drip-feed to the US. Grid delays are one thing, munitions running low is another.
It’s not only the munition shortage risk either. Running with the Casino Royal analogy, Trump is well aware of the danger he faces as energy prices rip and inflation with it.

The Government has been able to financially engineer its way out of recent crises, but oil is a completely different beast, and no amount of paper trading in the oil futures market will resolve this.

“It could dampen speculation with traders knowing that the U.S. government is taking the opposite side, which should moderate the spike in oil prices, but it does not solve the disruption to physical supply, which is significant with the closure of the Strait of Hormuz, and there is no spare capacity outside of the Gulf.
In surplus markets, paper sets the price; in deficit markets, physical sets the price, and we are currently staring at a huge deficit.
You can’t print oil…. The SPR can only release at 2-3mbpd and has already been drawn down by 42% to give Biden a few political brownie points.
What’s the play?
I have out-of-the-money CL WTI futures, which, up until this point, were burning a hole in the corner of the portfolio. They are now very much back in the green due to oil volatility spiking alongside oil prices.
1% CL Nov17’2026 $110 strike calls at 0.95c per future option contract
1% CL Nov16’2027 $110strike calls at 0.66c per future option contract
The volatility ship has sailed for asymmetry in these, and now it is a question of how to exit well, particularly on the Nov17’2026 110 strikes.
The beauty of these trades is that I’ll get a cash injection into the portfolio right when it will be most useful. My rough plan is to exit if we get into the $150-200barrel range and plough the proceeds into the EM exchange operator(s) who’ve taken the biggest hit.
Yes a fat lot of good this does anyone unless you already had the trade on and likely suffered like I did in it for years…. it was the Pain Trade*.
*One thing I hate is the intellectual dishonesty of victory laps on a return on the option that came home while ignoring the premium that went to heaven… All up, I’ve burned ~6% in oil option premium to date, so I need a minimum of 3x on the remaining calls to break even. At 6x I’ve really only doubled my money… So, unless I nail a serious multi-bagger, the whole adventure has been a poor use of capital (as I touched on in the piece).

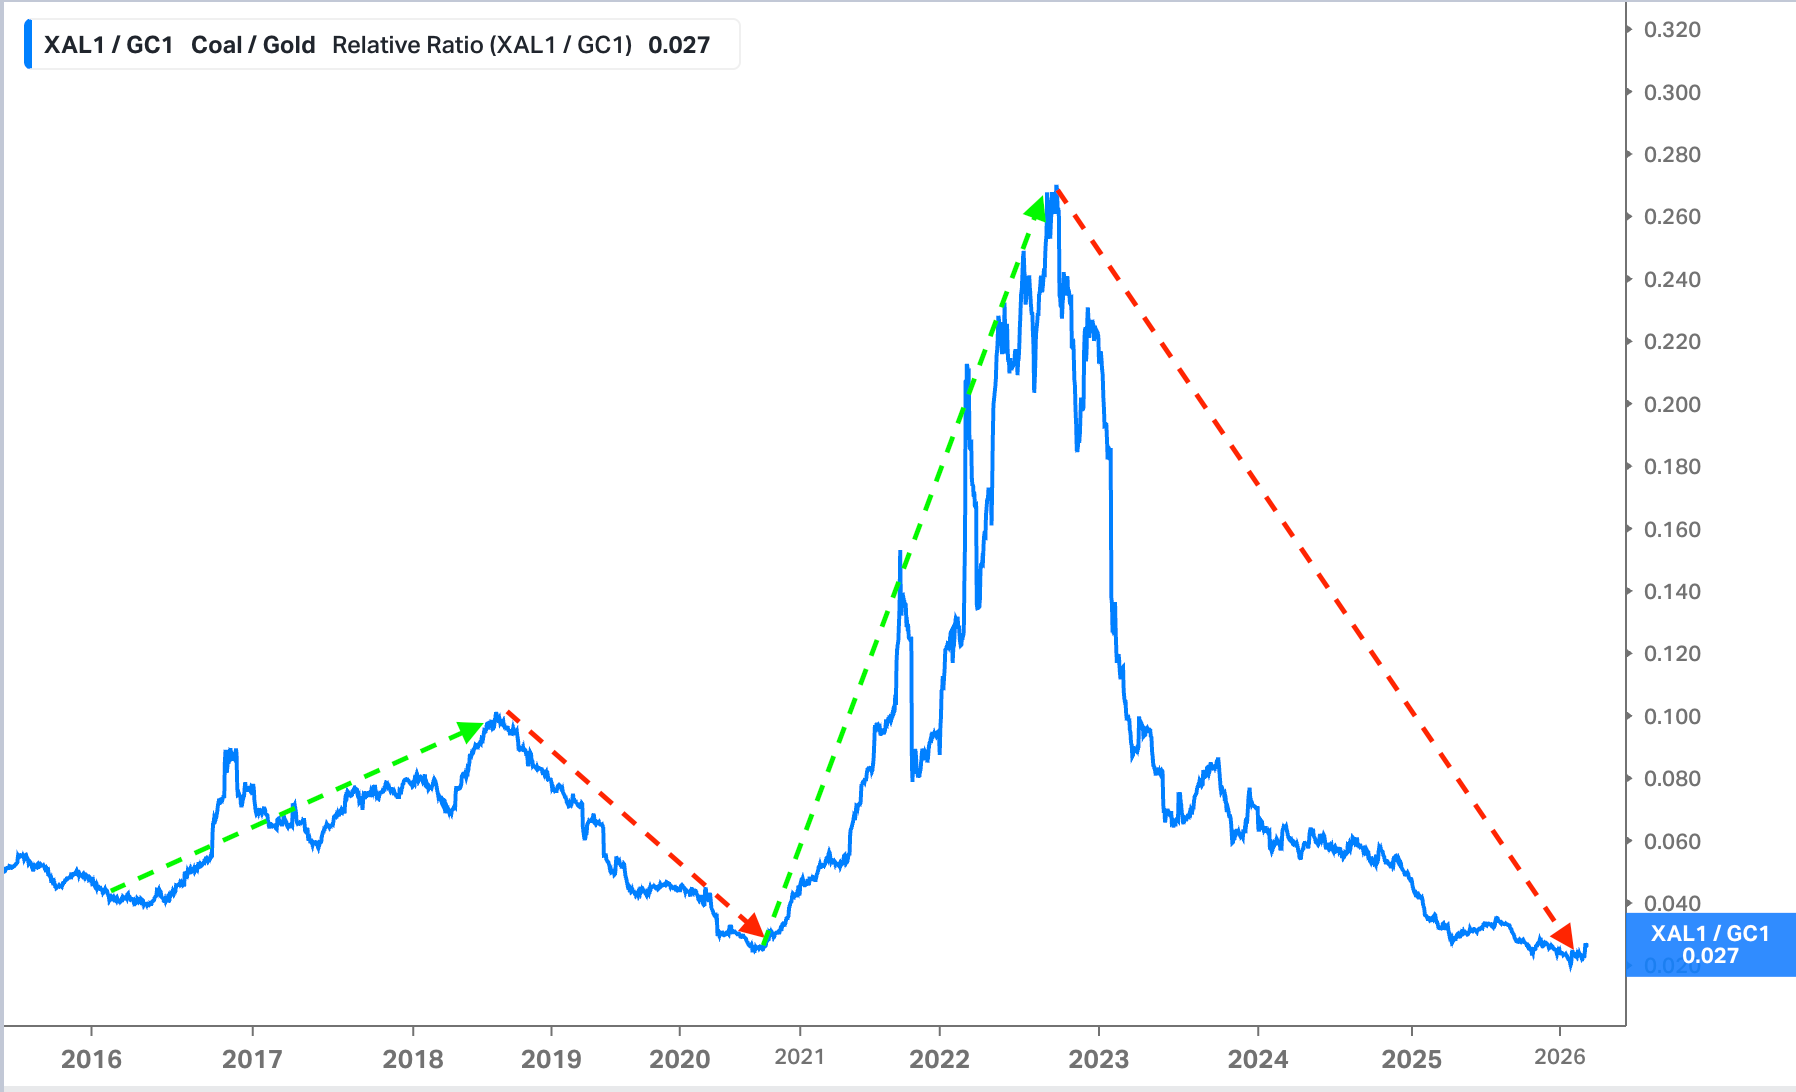
What has my attention is thermal coal
If something really runs US tech (QQQ), while something else gets really crushed like thermal coal, it doesn’t take a lot for the ratio to flip the trick is being able to spot the inflection which is really tough.
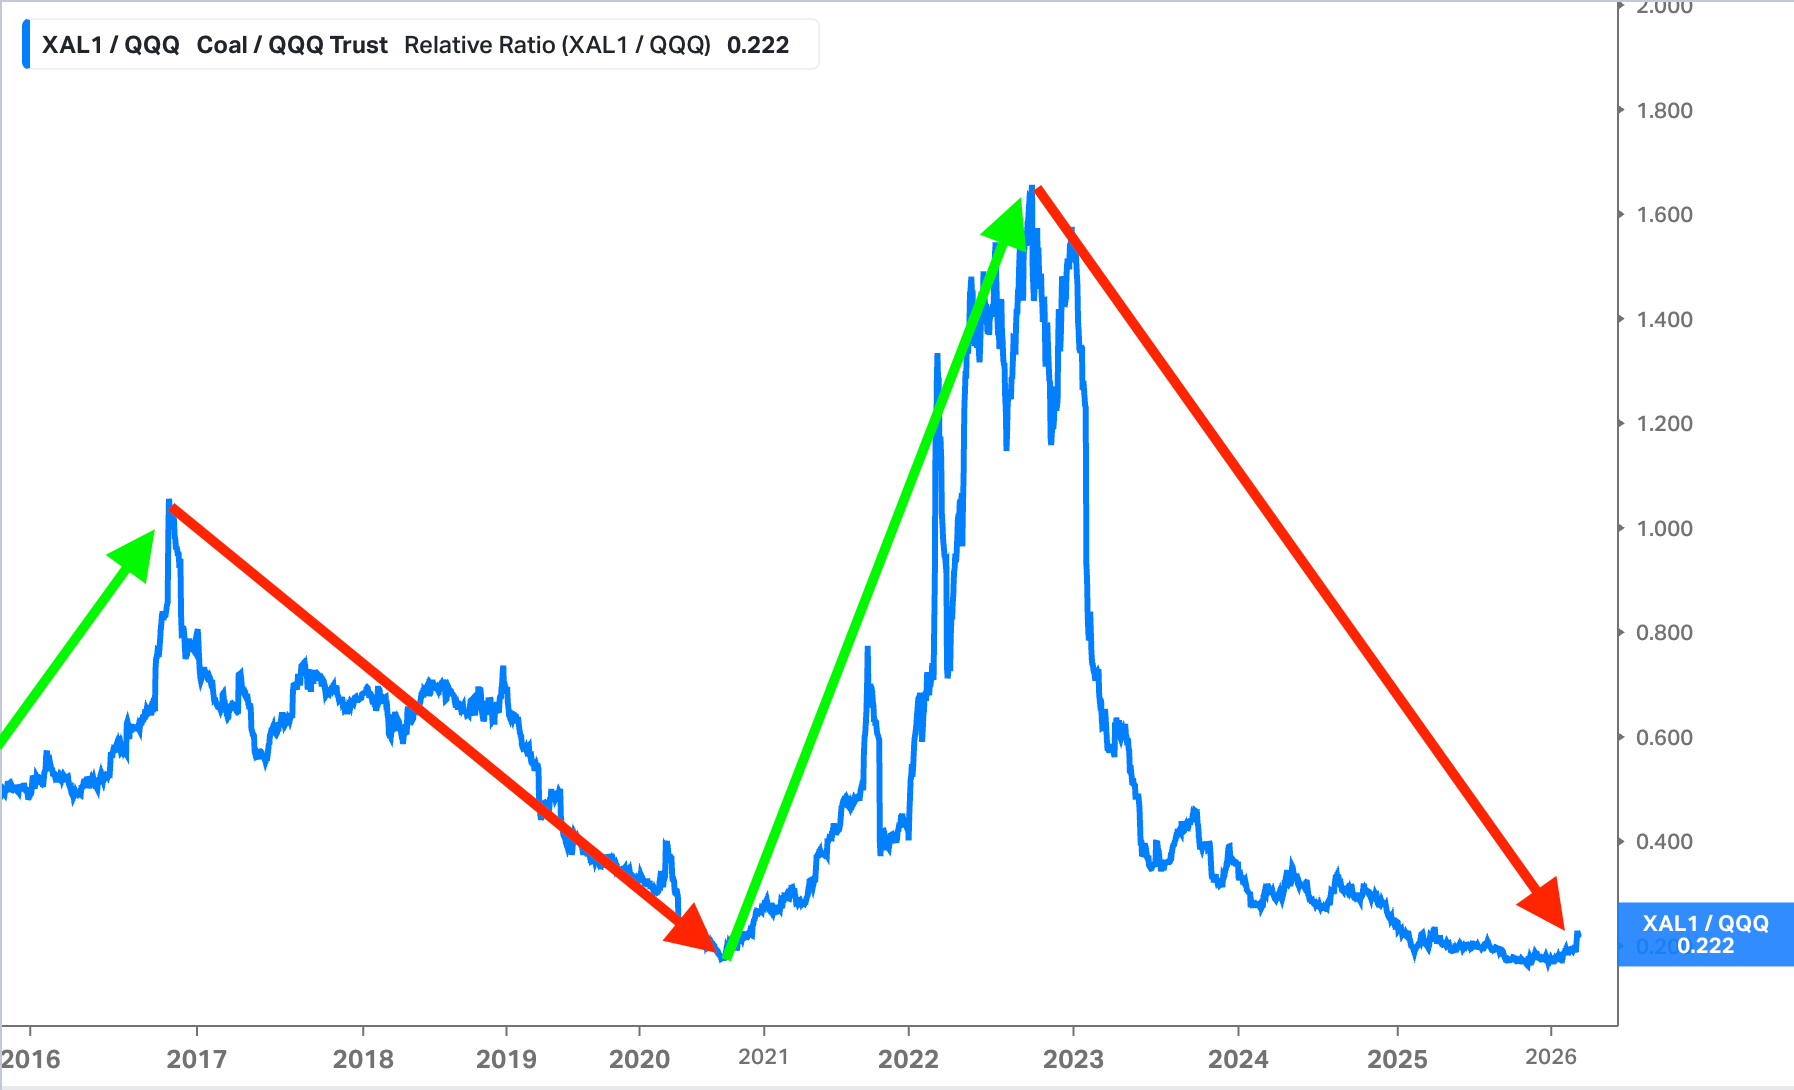
For example, if you have a five-bagger, then to get to a ten-bagger is really a double, for that ten-bagger to now double again becomes a really big ask vs something that’s complete roadkill, i.e. if anything at all goes right, it’s a quick double.
Which is where I believe we find ourselves with thermal coal again.
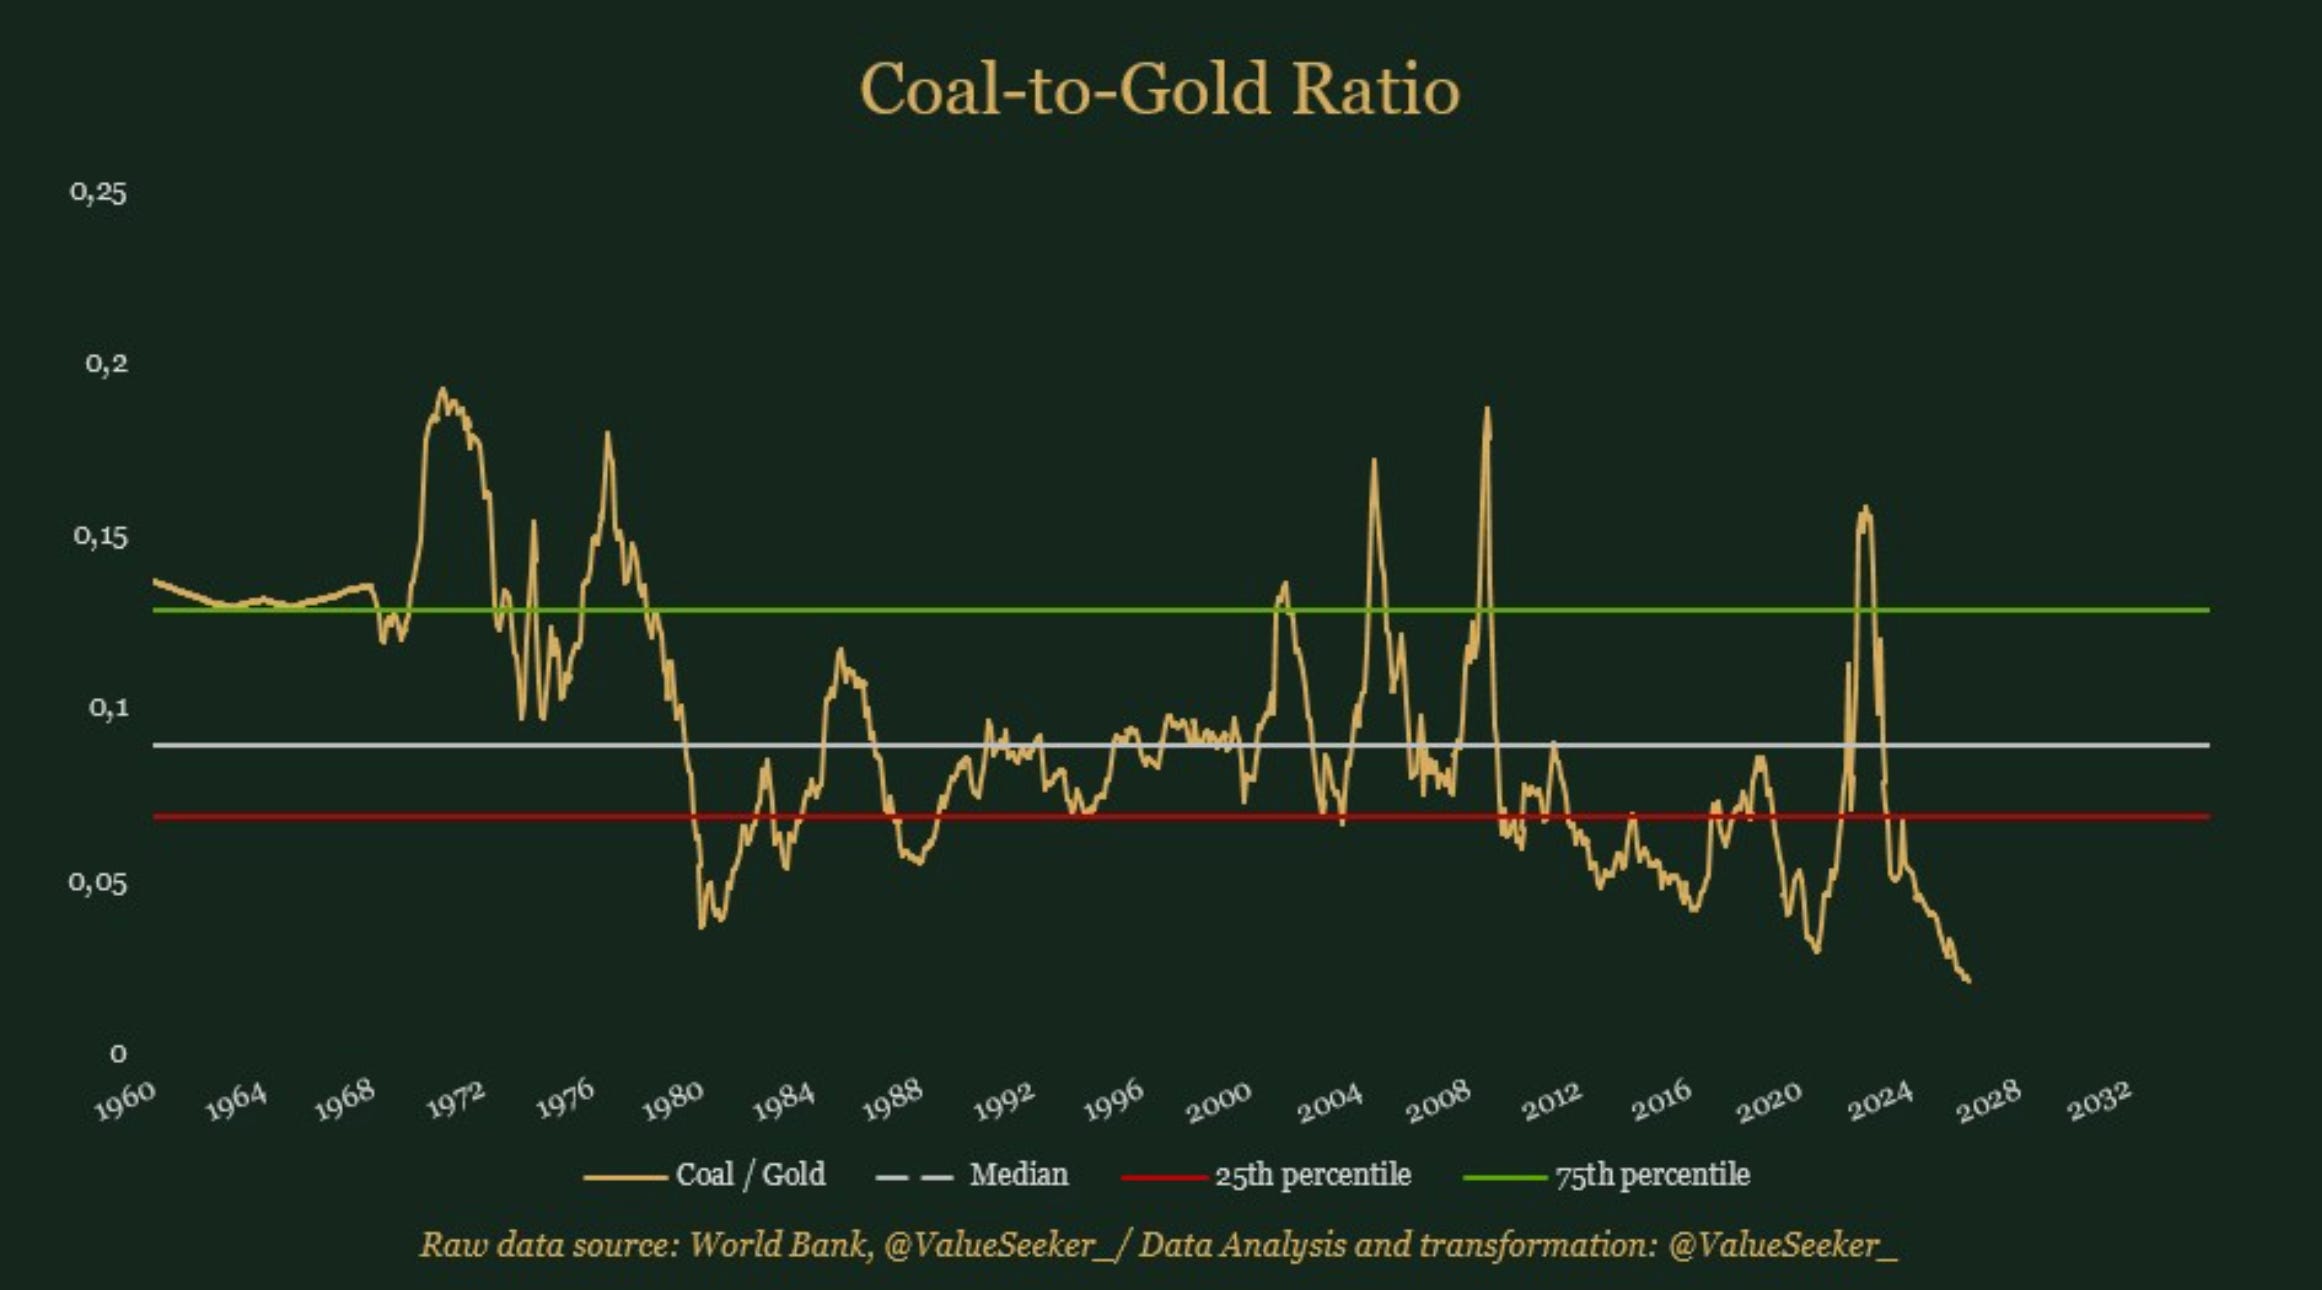
I’ve observed the cyclicality of the coal-to-gold ratio and wish I’d been smart enough to rotate from coal miners to gold miners in September 2022.
This begs the question, what if I’m staring at the peak in this ratio again?
It’s easy to make the bull case for gold here (Luke Gromen does a fantastic job of the gold bull case), and I remain a big gold bull, but I have a thing for roadkill that is showing signs of life.
Koyfin coal data only goes back to 2015, but I came across this amazing chart by @ValueSeeker that illustrates how the ratio has been highly cyclical since the 1960s.
Ultimately, I’m going to stay long both coal and gold; it’s just the weightings that will vary.
My bread and butter set-up
When I see this set-up in a cyclical commodity that is bombed out with negative sentiment, I’ve learned to just pull the trigger (the rhodium chart was nearly identical a year ago).
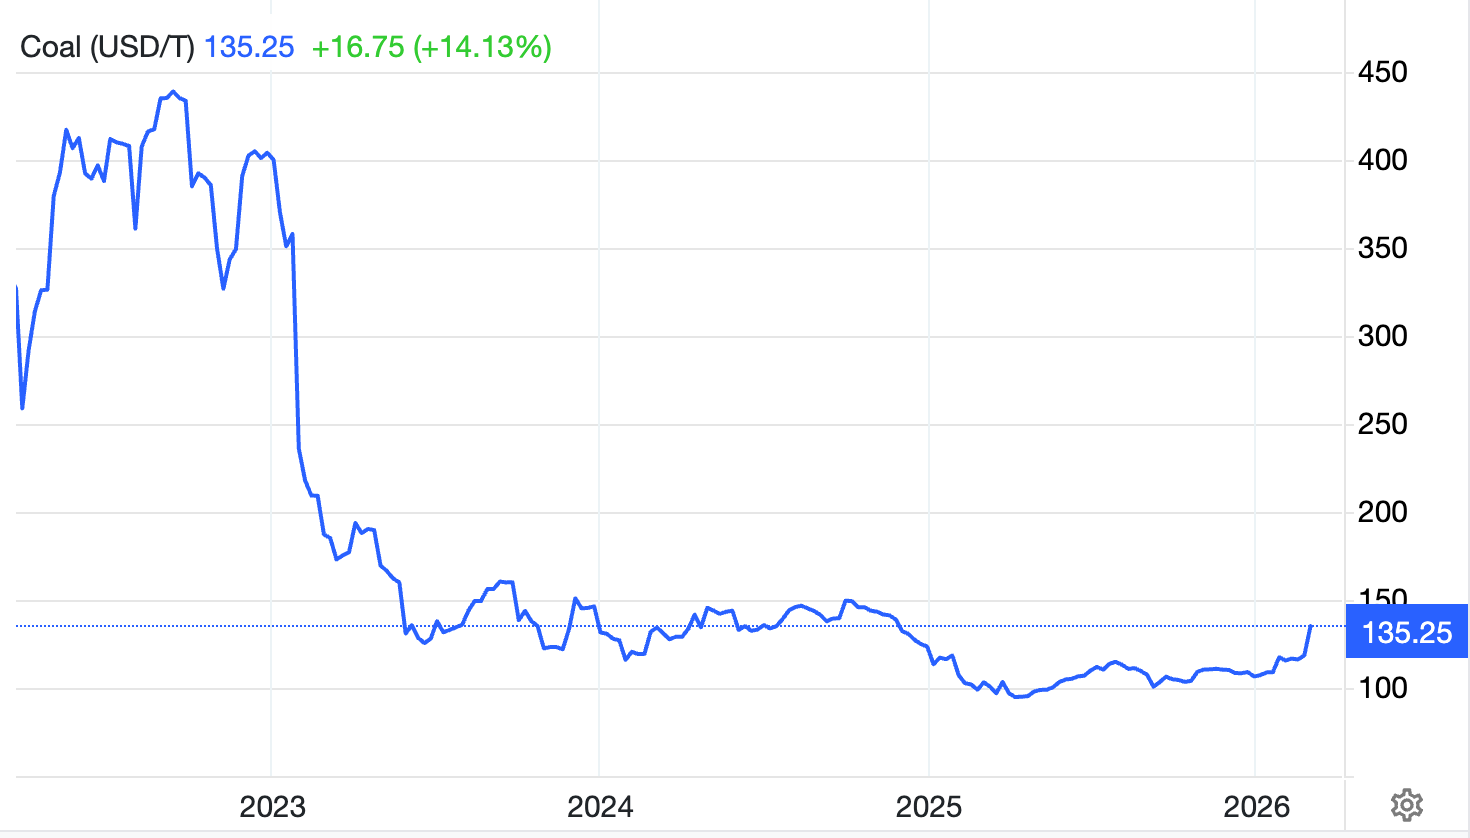
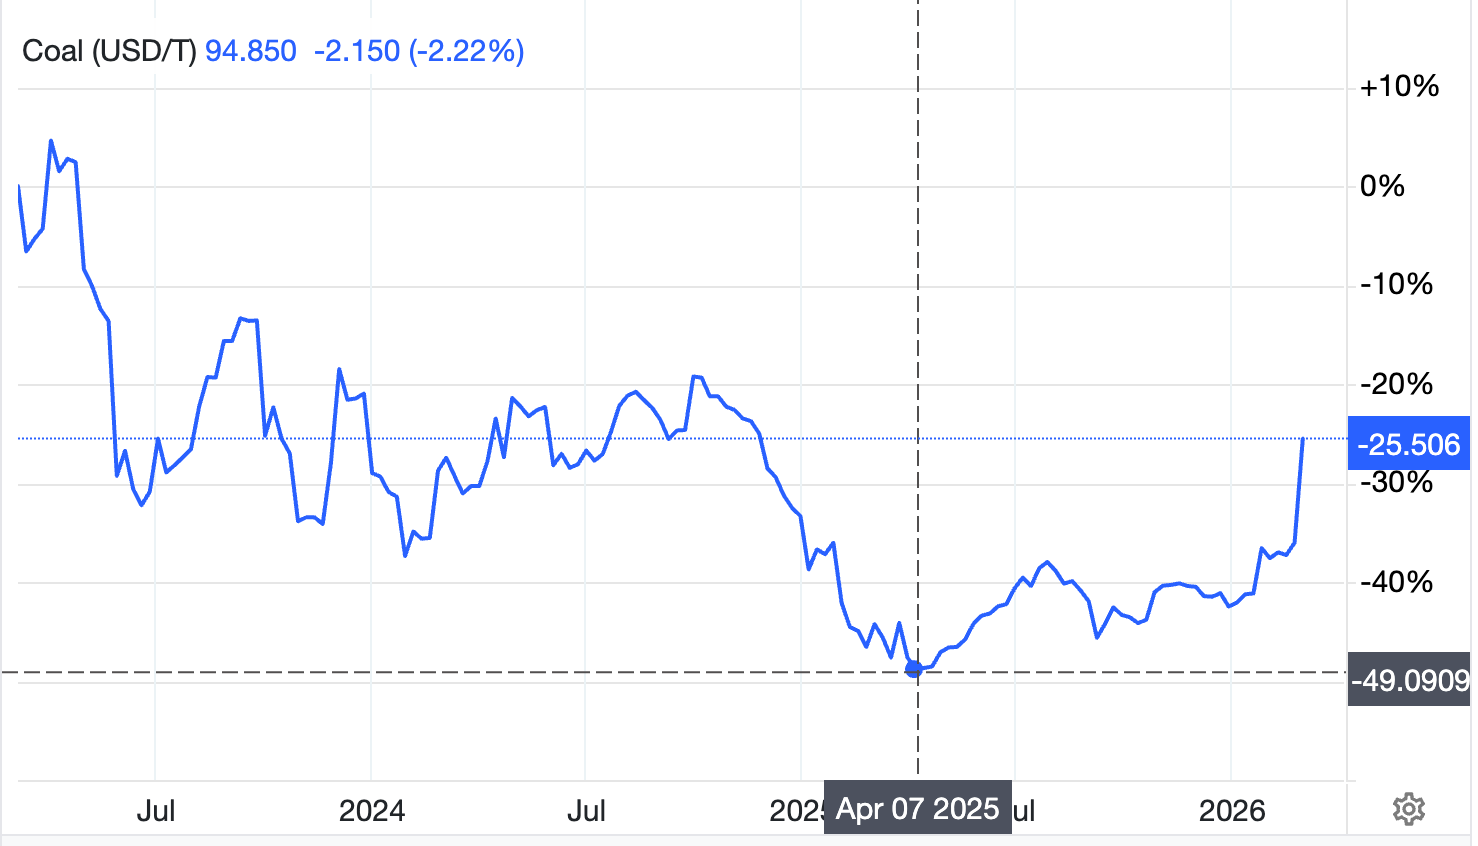
That period from April 2024 to April 2025 was brutal across the entire energy sector, yet similar to oil, it’s looking like we but in a bottom on Liberation Day.
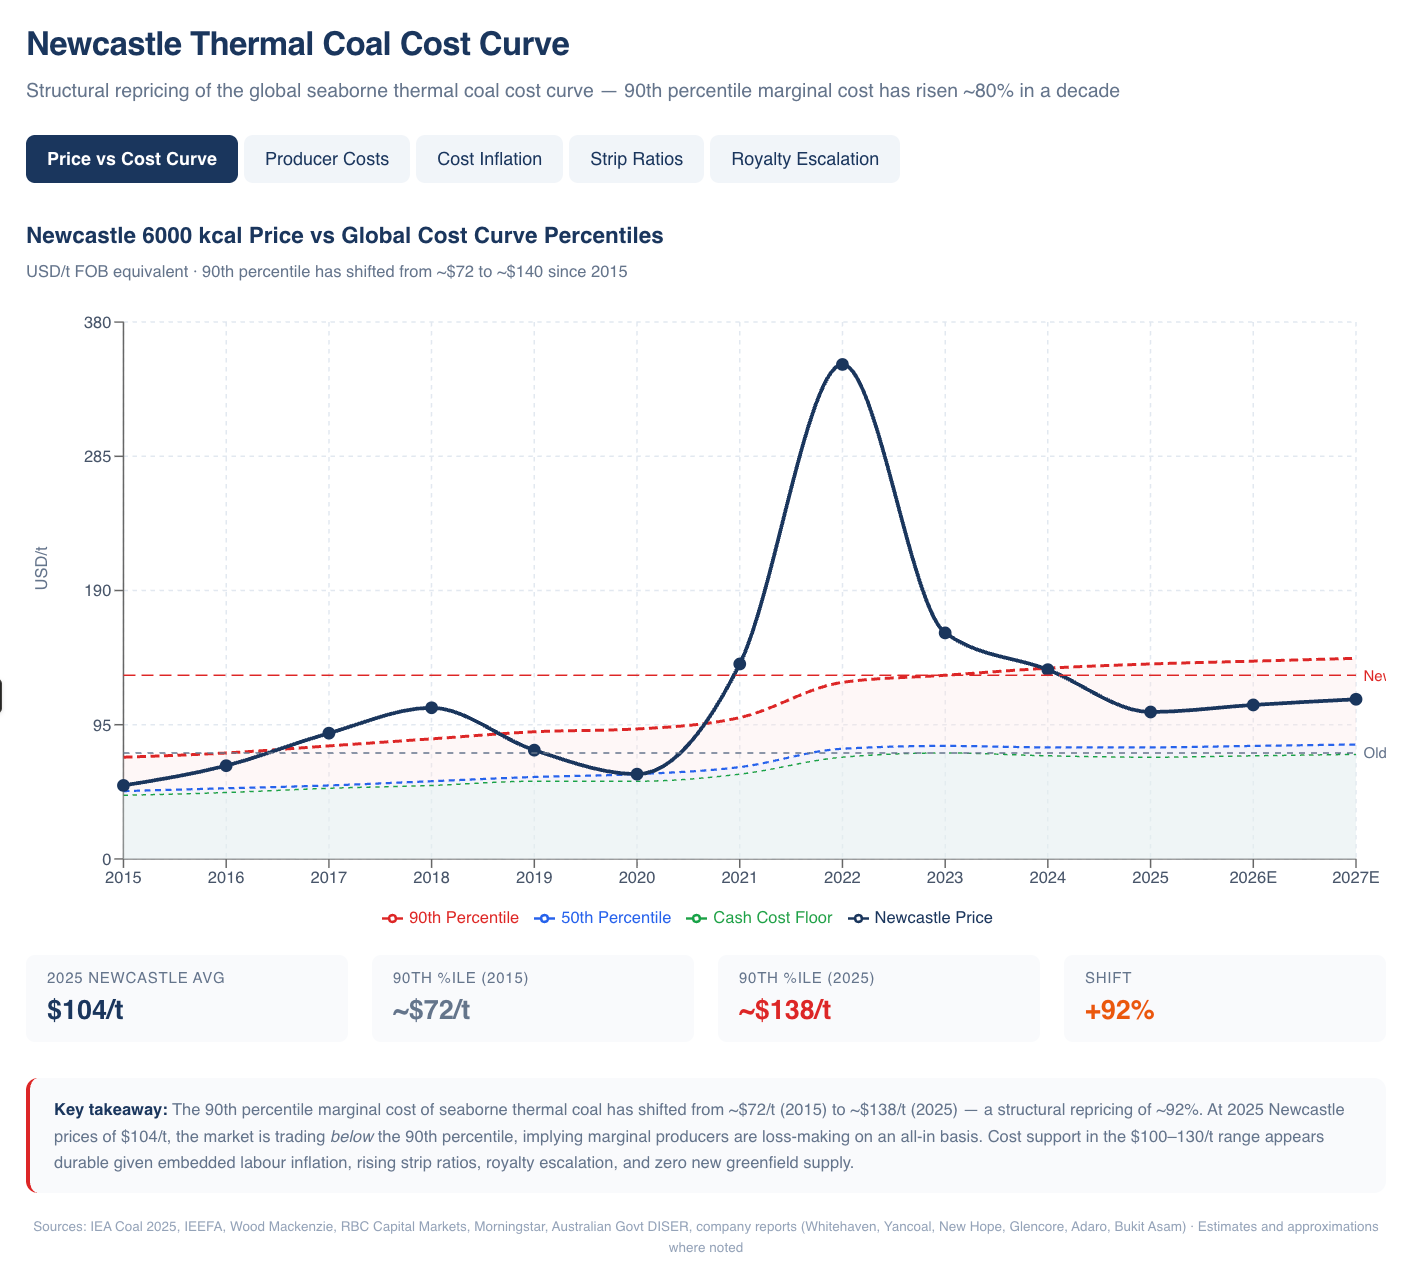
The below chart does a good job of visualising how the price dips below the high end of the cost curve for as long as it takes to shutter production or send high-cost producers bust, thereby tightening supply.
After enough time passes, we get a breakout.
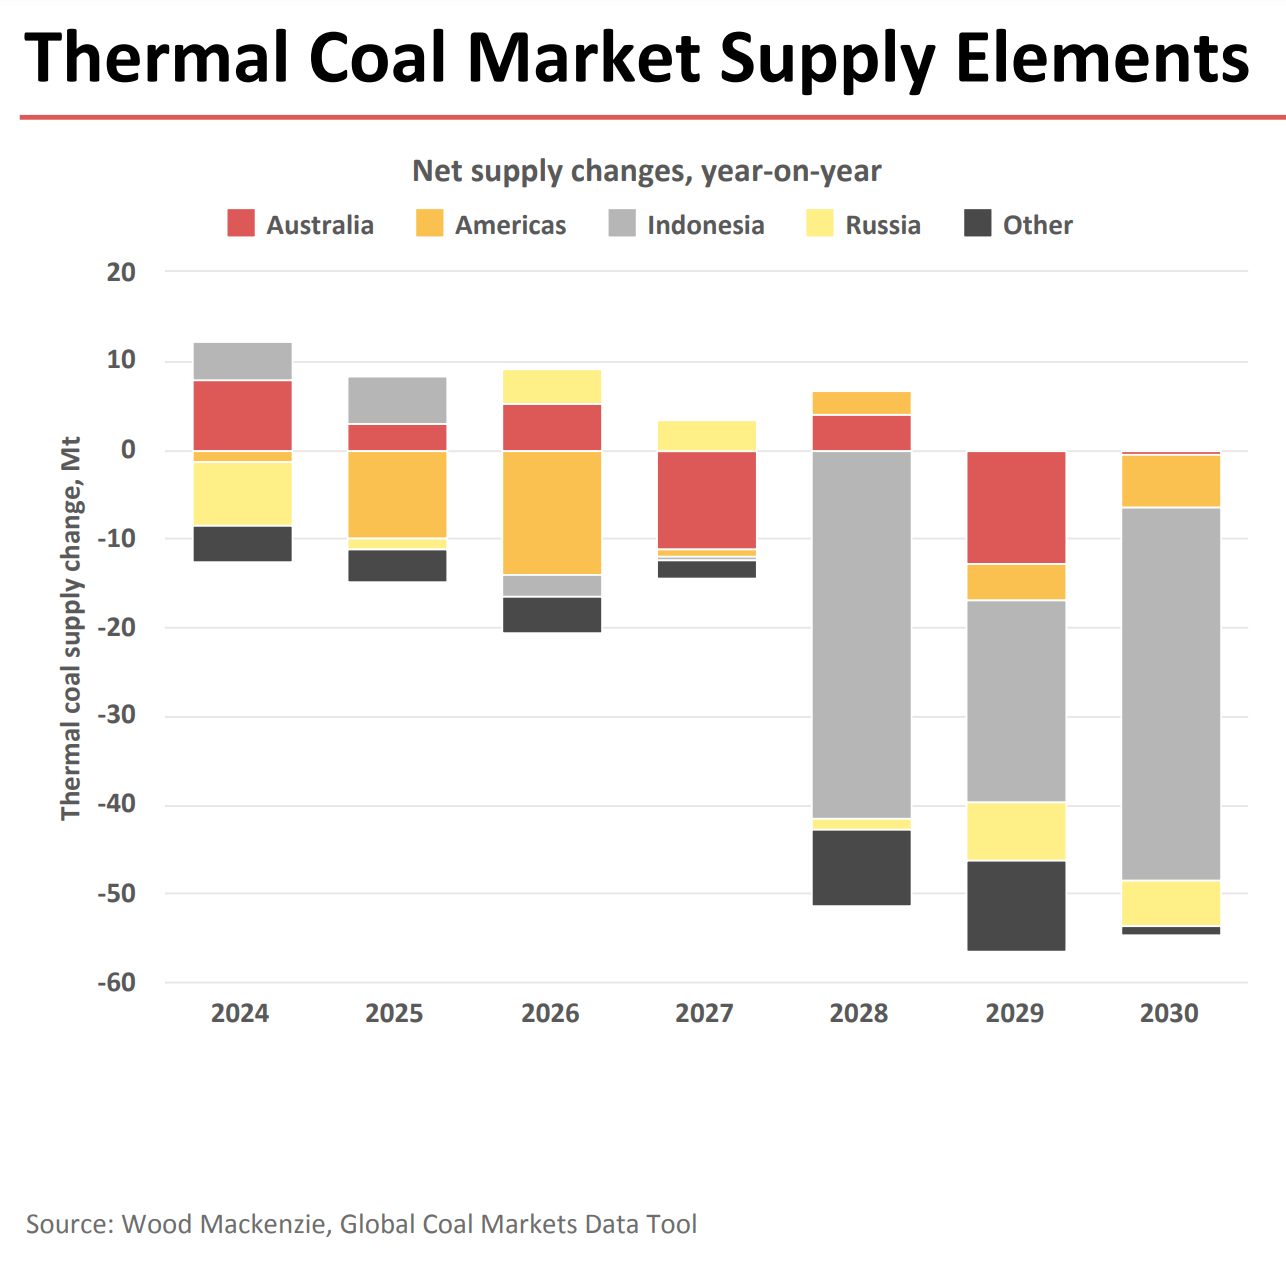
Between 2023 and early 2026, roughly 80–110 million tonnes per annum (mtpa) of thermal coal production capacity has been shuttered, curtailed, or placed on a managed decline trajectory globally, with another ~190 mtpa targeted for removal via Indonesian government quotas in 2026.
It’s key to note that these aren’t ‘care and maintenance’ situations, which can be brought back online when prices improve; the majority are due to reserve depletion and planned end-of-mine-life rather than sudden, price-driven shutdowns.
Take these recent examples:
Glencore closed four mines;
Newlands in Queensland’s Bowen Basin (5.5 mtpa) ceased operations in February 2023 after 40 years.
Liddell in the Hunter Valley (4.5 mtpa) mined its last coal in July 2023 after over a century of operations.
Glendell, part of the Mt Owen complex (3.7 mtpa), stopped mining after the NSW Independent Planning Commission rejected its continuation project in late 2022.
Integra Underground (2 mtpa) closed in mid-2024, brought forward from its December 2024 schedule due to adverse strata conditions.
Whitehaven Coal's Werris Creek (1.5 mtpa, closed June 2024, due to reserve depletion).
Yancoal's Stratford Coal (1.5 mtpa, closed May 2024, due to 30-year mine life exhausted).
Peabody's Wambo Underground (~3 mtpa, closed September 2025, brought forward from 2026 due to challenging geological conditions).
Australian Pacific Coal’s Dartbrook mine collapsed financially in July 2025 after restarting in late 2024, entering administration in NSW with over $200 million in debt.
The single largest future closure is BHP's Mt Arthur: Australia's biggest thermal coal mine at ~15 mtpa actual production: scheduled for permanent closure by June 2030.
Then comes Indonesia, which is by far the most significant.

The Indonesian government is now targeting just 600 Mt of production in 2026 (versus 790 Mt in 2025). If enforced, this would represent the single largest supply-side intervention in seaborne thermal coal history, though enforcement remains uncertain. Roughly 300 mining companies failed to submit 2026 quota applications.
I have no idea what the probability is of this quota being enforced this year, other than to note that last year’s reduction was enforced.
When you combine this outlook with the Australian outlook, it’s hard not to get bullish, as it’s pure destruction on the supply side for seaborne thermal coal, and it accelerates from 2028 on.
The Catalyst
Thermal coal stands to benefit from 20% of the world’s LNG, or ~83 million tonnes per year, via Qatar (~93%) and the UAE (~7%) being prevented from transiting the Strait of Hormuz.
There is no viable alternative route for LNG; it’s trapped, and with Ras Laffan offline (100% Qatar LNG), even if there is a resolution tomorrow, we are looking at 2-4 weeks minimum before things are running back at full capacity.
Roughly ~83% of Hormuz-transiting LNG flows eastward to China, India, South Korea, Japan, and Taiwan. While Europe absorbs the remaining ~13% of Qatar’s LNG export
Fuel Switching
So, the base case is that we will see a knife fight between Europe and Asia as they compete for the same high-CV 6,000 kcal coal.

The impact of a halt in LNG flows through the Strait of Hormuz would be comparable in scale to the curtailment of Russian gas supplies to Europe four years ago. Then prices soared to nearly US$100/mmbtu at their peak (equivalent to almost US$600/bbl Brent) and averaged US$40/mmbtu in 2022. This time, however, the reaction will hardly be as extreme as the closure of the Strait of Hormuz is likely to be temporary.
There is no better set-up than cheap valuations combined with a catalyst and solid longer-term bull case.
Longer Term Bull case
If you grow your GDP, you use more electricity, and there is zero chance that wind and solar can keep up with the electricity demand of emerging markets.
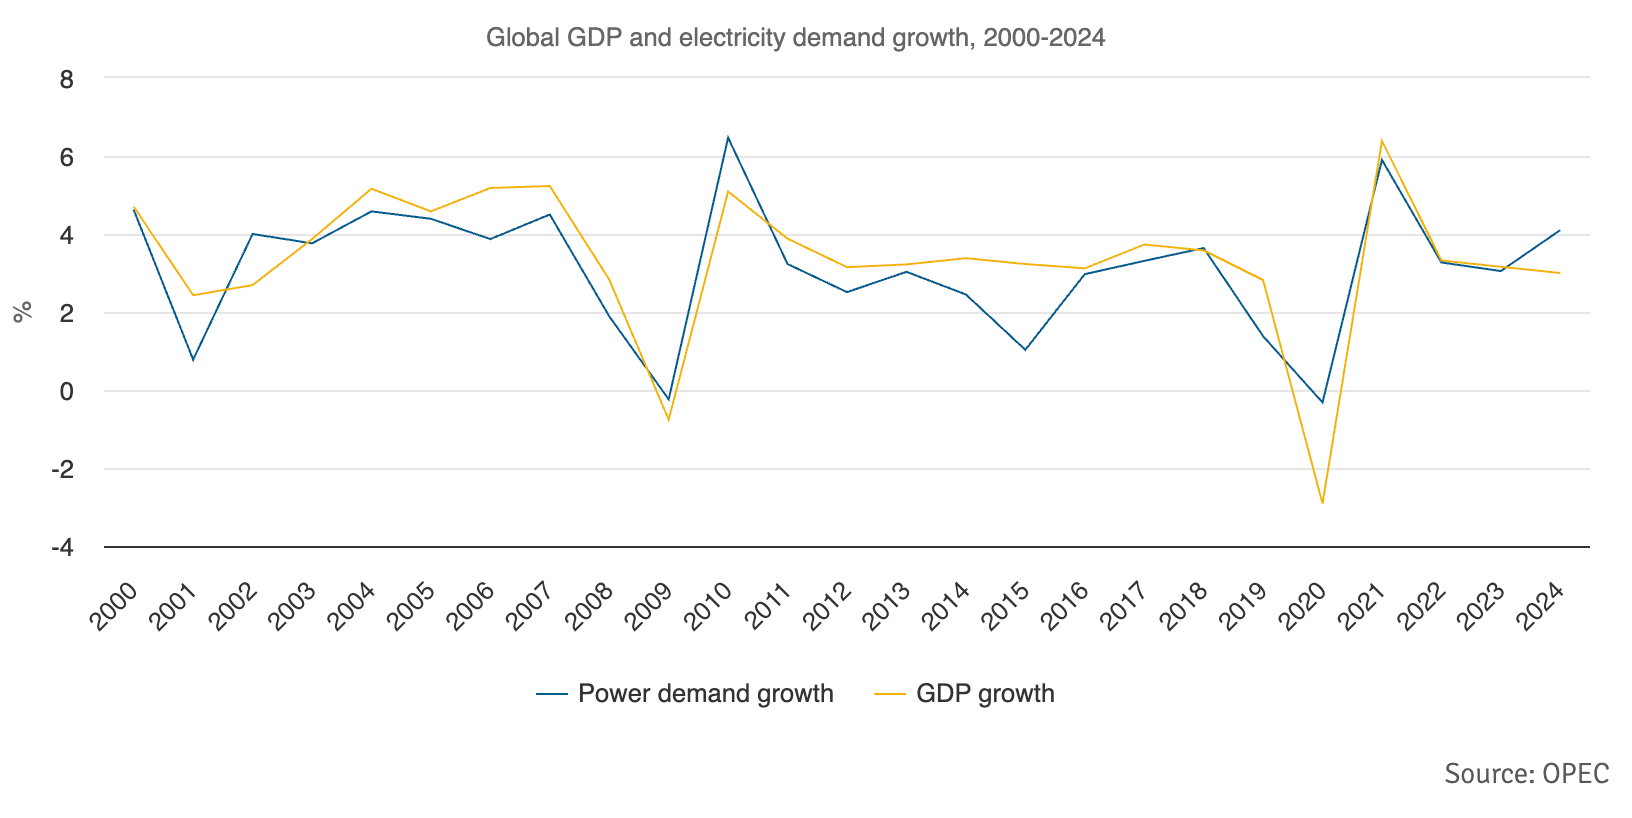
I’ll save you the long macro thesis, which I went over here (The Big Addition), but in summary, using OPEC’s data, not IEA, which is even more bearish on thermal coal.
Assumptions
China’s primary energy demand isn’t going to grow between now and 2050 (figure 2.2). Quite the assumption……
China’s coal demand is going to drop 8% between 2024 and 2030 and 12% between 2030 and 2035 (figure 2.6).
Acknowledge there is 94.5GW of new coal plants under construction and 66.7GW permitted (figure 2.5). If you’re wondering how coal demand is forecast to decrease by ~8% while China’s coal fleet expanded by ~21%, it’s due to the assumption that utilisation drops from ~50% to ~30%.
Wind and solar are assumed to replace coal over the next 26 years, as shown in the chart below.
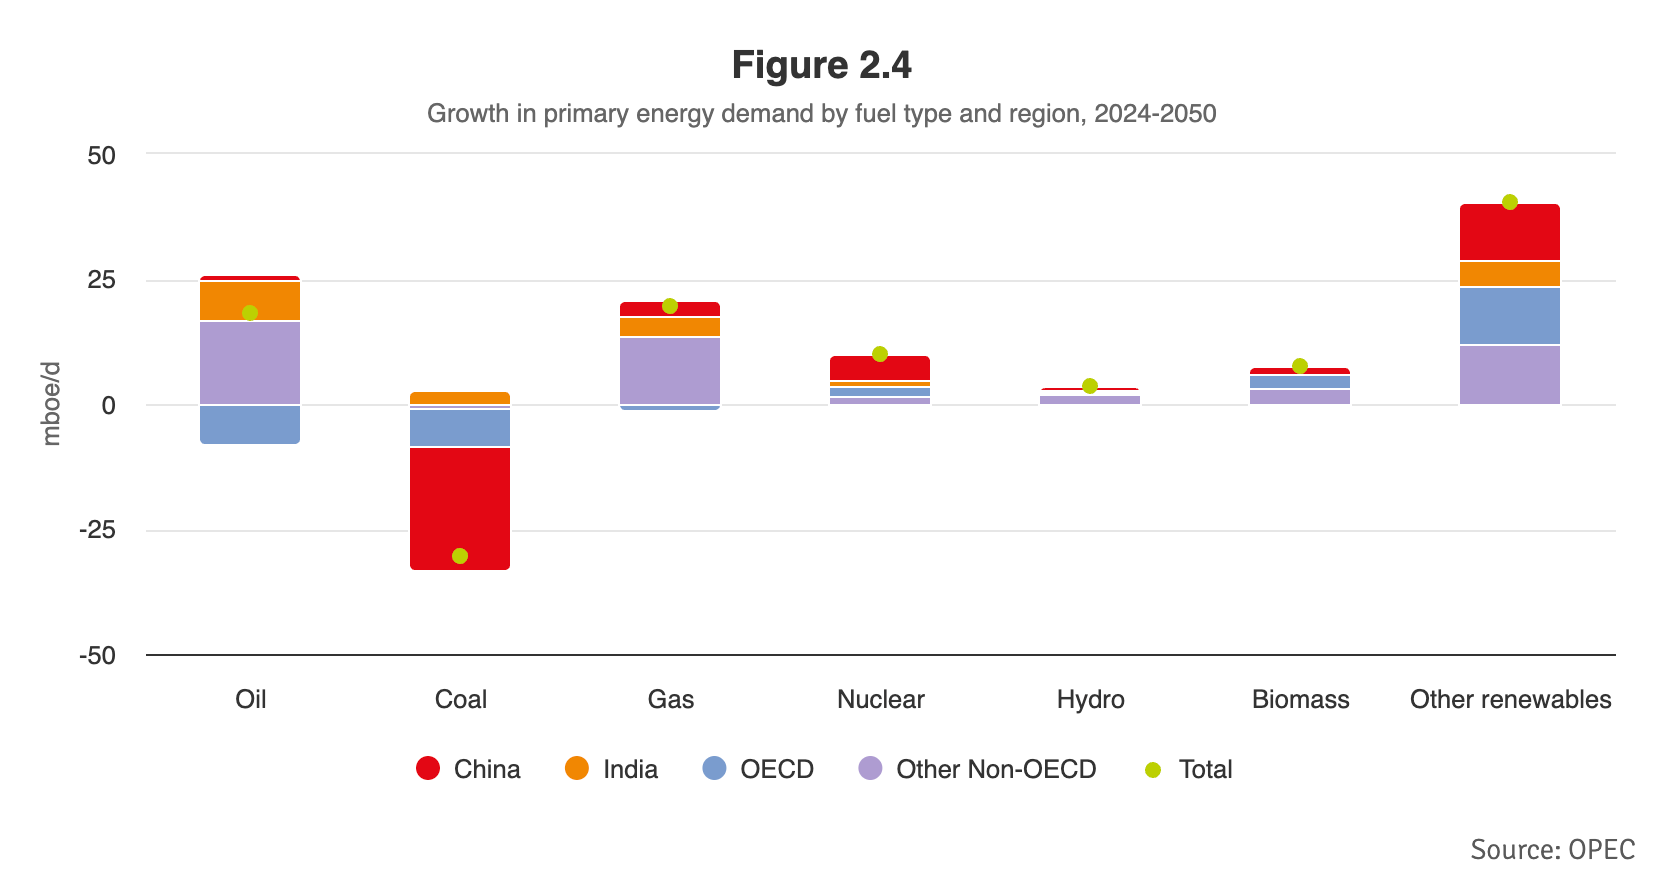
I’ll take the other side of these projections all day long as China’s coal fleet is all but guaranteed to grow 17% by 2029, probably 23% with permitted projects and possibly 40% if planned plants are permitted.
Yes, 40%. You read that correctly.
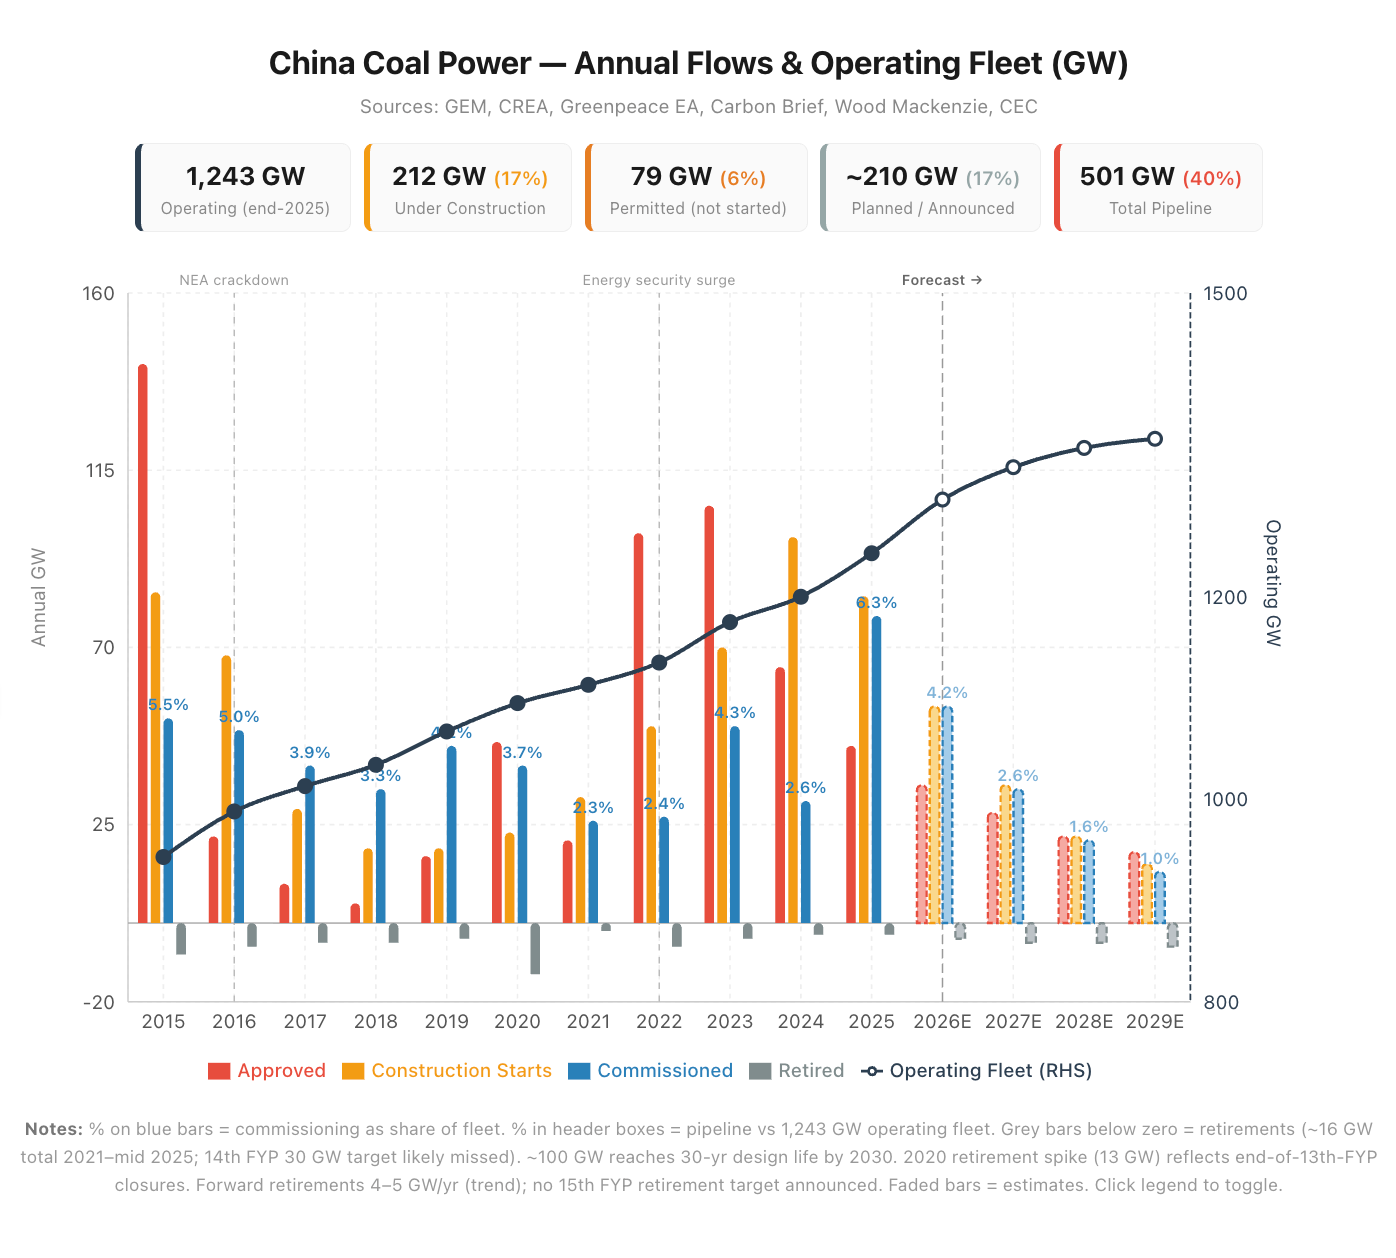
The entire idea of coal demand dropping is based on coal plant utilisation declining, which in turn is based on China’s energy demand remaining flat over the next 24 years…