Happy New Year, everyone!
Last year was rough, with few places to hide if you hung out in commodities/energy like I do.
I’ve been at this game long enough to know markets have a way of tempting you into doing exactly the wrong thing at the wrong time.
For retail its the FOMO of missed gains while for the professional its career risk of not having owned Nvidia or any of the Mag 7.
One of my favourite examples of this was Julian Roberston during the Dotcom boom:
After 20 years of generating superlative investment returns by buying stocks that were undervalued and selling short those that carried excessive valuations, Mr. Robertson, 67, confirmed yesterday that he was shutting Tiger's operations. He has essentially decided to stop driving the wrong way down the one-way technology thoroughfare that Wall Street has become.
There is a deep irony in that he was being forced to sell value into the hole, which set the stage for its outperformance. By March 2020, every last incremental buyer of tech had bought, while all but the most stoic value investors had sold.
''This has been a long process,'' Mr. Robertson said. ''Since 1998, we've been trying to take the leverage out of the funds. Because of partner withdrawals, we've probably sold or bought between $60 and $70 billion of securities.''
It is not lost on Mr. Robertson that many of the same stocks he had been betting against in recent months -- Internet shares, technology stocks and other beloved new-economy stocks -- have been in free fall since Tiger's shutdown became public. In the last four trading sessions, the Nasdaq composite has lost 10.2 percent. ''If we had been in business this week, it would have been one of our best weeks ever,'' he said.
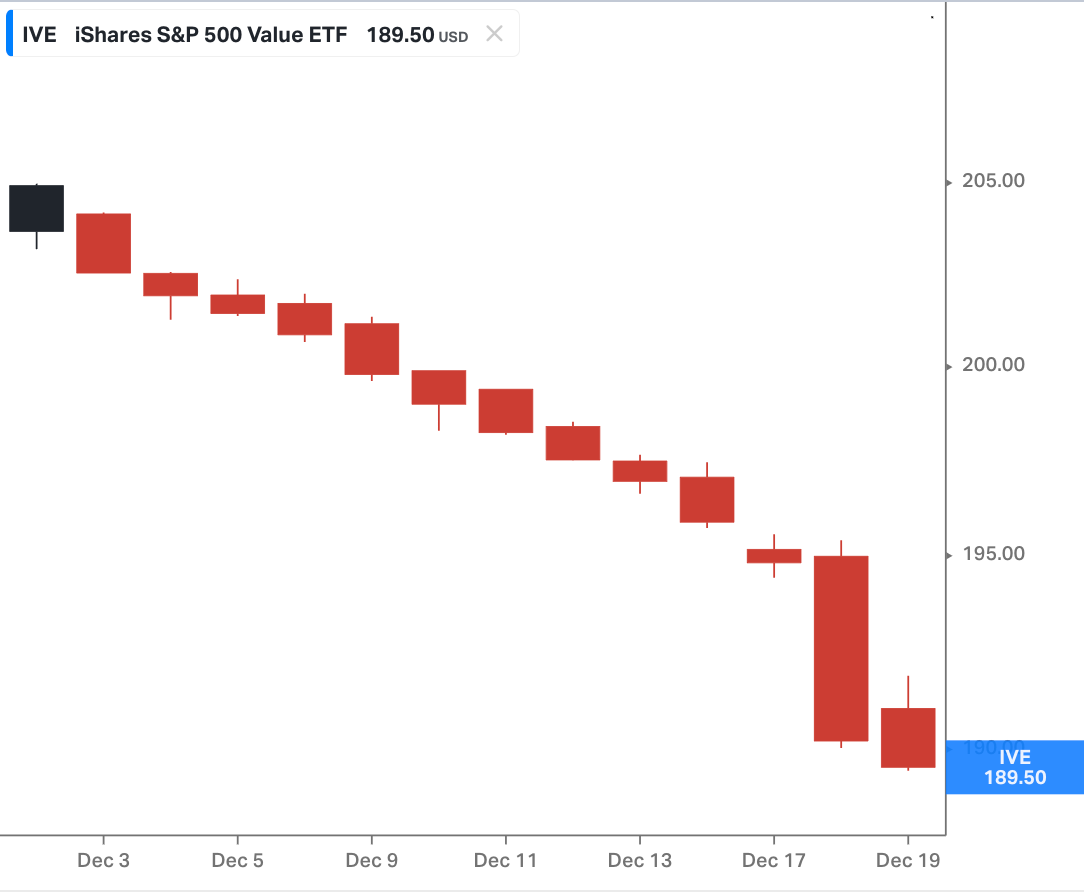
I imagine that the last quarter before the Dotcom bubble peaked looked similar to what we’ve been experiencing with value here.
The market wasn’t prepared to give value a single green candle for Christmas.
This is why Brad always reminds me that being patient and staying at the table is one of our biggest advantages as retail investors.
It’s at the point concensus decides is that something is a lost cause is when it will start working, and keep working for a long time.
It's not hard to look at the weightings below and say they're silly; the hard part is stomaching the fact that they get sillier and stay that way for longer than you'd think is possible.
Everyone and their dog expects nothing but disappointment from oil.
"Oil sentiment is a funeral" here, as my friend Paulo Macro quipped in a recent exchange.
The two key factors most commentary is focused on in the oil market are:
oil demand growth being weak globally
strong non-OPEC supply growth expected
So, with that said, I'll dig into both of them.
Oil Demand
Oil demand growth is one of the most robust trends globally.
You can pencil in an average growth rate of 1.1-1.3% annually and know that even when losses are experienced, the trend returns relatively quickly (when it gets cheap, we use more).
Take these examples:
Global Financial Crisis which was a -2% hit on oil demand YOY following which it bounced back with 3.8% growth in 2010.
Government Lockdowns: Locking people in their homes globally in 2020 resulted in a -8.5% reduction YOY (not the -30% most predicted) followed by 6.2% growth in 2021. Articles like this were doing the rounds in 2020: Peak Oil is Suddenly Upon Us).
Humanity’s thirst for oil may never again return to prior levels. That would make 2019 the high-water mark in oil history. -BP 2020 Energy Outlook
Two years later we were making all time highs…
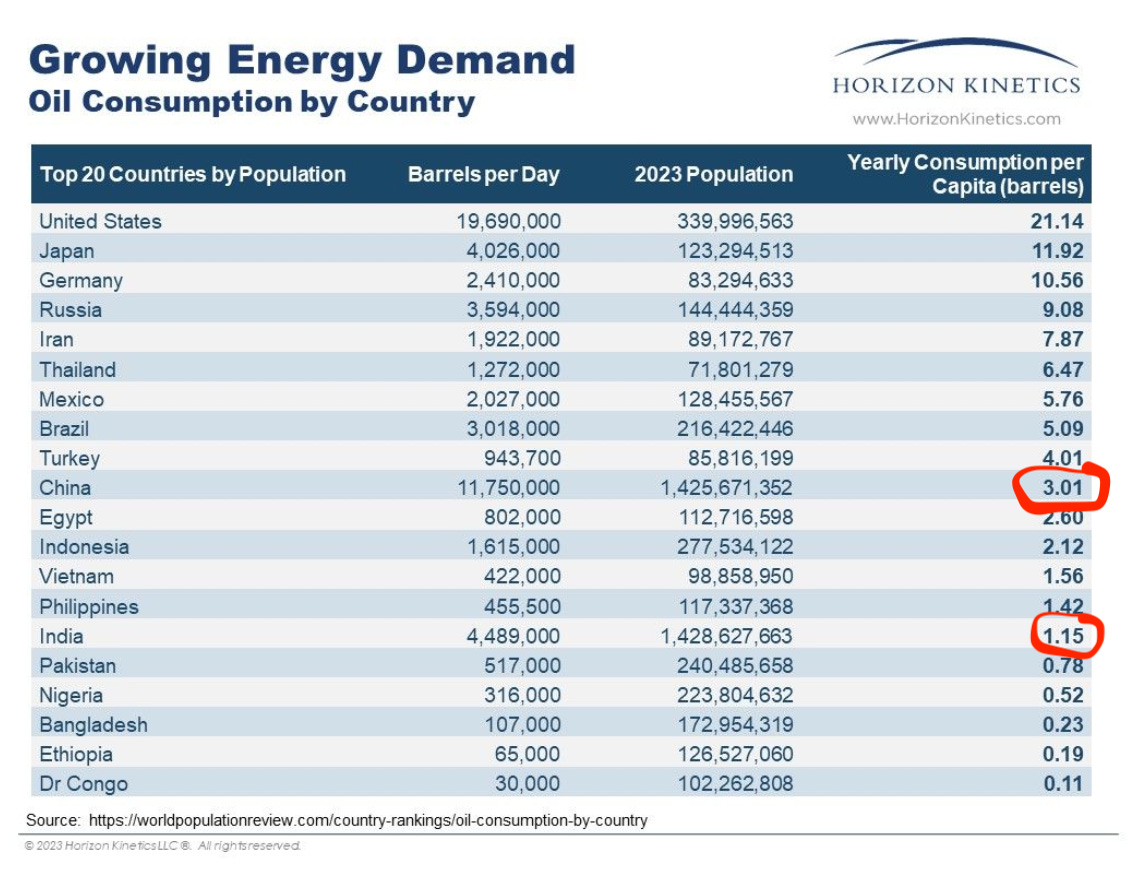
You have to devise an extremely bearish scenario to keep oil consumption growth down or even negative. The simple fact is that 6.9 billion people in developing countries consume an average of 3 barrels per person per year and fight to increase that/their standard of living.
Plus, those same developing countries will add 2 billion people over the next 20 years who will need their 3 barrels at a minimum.
Do we really think India is going to stay at 1.15 Barrels per person per year or Nigeria is going to stay at 0.52 barrels per person per year?
Weak Chinese oil demand
Mainstream media is full of these headlines:
China’s EV Boom Threatens to Push Gasoline Demand Off a Cliff
The more rapid-than-expected uptake of EVs has shifted views among oil forecasters at energy majors, banks and academics in recent months. Unlike in the US and Europe - where peaks in consumption were followed by long plateaus — the drop in demand in the world’s top crude importer is expected to be more pronounced. Brokerage CITIC Futures Co. sees Chinese gasoline consumption dropping by 4% to 5% a year through 2030.
While I agree that the days of rapid oil growth are behind China, with it making reducing its oil dependence a priority, I see slower consumption growth or, at worst, a plateau as the most likely outcome.
Anas Alhajji has broken down the China demand story better than most of the oil analysts I follow:
His main points has been while regular headlines claim Chinas demand has peaked due to EV and LNG trucks it only accounts for a quarter of the decline in Chinas oil consumption.
There are about 25 million electric vehicles of all types on the roads. Their “direct” replacement is only about 600 kb/d. Looking at all Chinese EVs and LNG truck sales since the beginning of the year their direct replacement is less than 250 kb/d, while the decline in China’s oil demand is more than 1.2 mb/d.
The rest (75%) is due to slow economic growth, which could bounce back if China achieves its 5% growth target (which stimulus should aid ‘moderately loose’ policy annouced for 2025).
The tougher question to answer is whether China will be able to grow at 5% with its demographics and property bust.
Europe is similar in that lower demand is held up as a victory of green policies by the media when the majority is slow economic growth, which could bounce back (not that I'm holding my breath with Germany).
Anas also regularly points out that analysts and journalists are ignorant of or ignore the Chinese use of inventories instead of imports. That means oil demand is higher than reported.
Indian Demand
While demand has disappointed over the last two years, I'm a huge bull on Indian oil demand moving forward. I encourage you to look through this chart book from John Kemp, with every page reinforcing the trajectory of their oil consumption.
The IEAs “Oil Glut”
Whenever reading oil forecasts from the IEA, it pays to remember their track record would make Cramer blush.
The group published its latest monthly report on Friday, revising its historical oil demand numbers all the way back to 2007. Yes, that's right, for the past 15 years the world has been using more oil than the primary monitoring agency that advises consumer governments thought. The changes aren't small. At 2.9 billion barrels, the additional demand they've just found is equivalent to five times the US Strategic Petroleum Reserve, or an entire year's worth of consumption in France, Germany, Italy, Spain, the UK and Mexico.
Gorozen has touched on it in multiple pieces. Ultimately, they underestimate developing countries' demand, which they put down to "missing barrels," which they then have to periodically revise.
The IEA heavily relies on Green energy to reduce oil consumption, which is overstated as I just outlined with China and EV/LNG only contributing to 25% of the reduction.
Main Demand Takeaway
Green policies have had minimal impact on oil consumption, with the vast majority due to slow economic growth, which can bounce back, especially with China adopting looser monetary policy.
Oil Supply
Decline rates are standard for all commodity businesses. What is often overlooked is the impact shale extraction will have on these decline rates moving forward.
Replacing conventional oil and gas's historic decline rate, which fell to 4-5% per annum, was no small task, but it was manageable.
Shales' arrival on the scene was timely, as it plugged the gap that was opening up between conventional supply and demand.
The enormity of this can't be understated.
The US shales provided the energy equivalent of two Saudi Arabias right when the world needed it.
Total liquid production from the US shales grew by 11.6 mm b/d – more than Saudi Arabia’s production of 10.5 m b/d. Shale gas production grew an incredible 65 bcf/d over the same period. When converted to barrels of oil equivalent, shale gas added another 10.8 m boe/d – equivalent to a second Saudi Arabia.
- Goehring & Rozencwajg
Finding all of this oil in such a short period comes with a catch.
The acceleration of decline rates
Pre-2021, Exxon presentations had decline rates sitting at 4-5% per year.
In 2021 Exxon presentations decline rates were increased to ~7% per annum.
IEA increased their decline rates to 8% pa, following which Exxon then stated in their August 2024 presentation due to lack of investment decline rate is up to 15%
Thats a hell of a hurdle just to maintain supply let alone keep up with demand growth.
Non-OPEC growth
There are four sources for non-OPEC growth moving forward: the US, Guyana, Canada, and Brazil. These countries are expected to add 930k b/d to their oil market balances by 2025. The US is expected to add two-thirds of this at 620k b/d.
This chart from OPEC outlook to 2028 illustrates how the US is expected to add the equivalent of all the other non-OPEC contributors combined.
The majority of this US growth is tight crude and unconventional NGLS which are forecast to keep growing to 2028 before plateauing and starting a steady decline.
This is where I’ve found HFI research’s work hugely helpful (happy paid subscriber) as he tracks US oil production real-time, removing a lot of the noise and “adjustments” by IEA and EIA.
His conclusion is that US oil production has been largely flat since December 2022 (which is a big deal when its supposed to be the main contributor to non-OPEC growth moving forward.)
Our estimate is for an exit of around ~13.45 million b/d, and a possible increase to ~13.6 million b/d by the end of 2025. But that's all the growth there's left.
Most of this production growth is coming from Exxon and Chevron. There will be others like Diamondback and Occidental that will be able to show some modest growth (~2%), but that's about it. Everyone else will be lucky to keep overall production flat.
-HFI Research
Oil majors aren’t interested in “Drill Baby Drill 2.0”
Despite the narrative Trump is pushing, oil majors are telling you it isn’t happening.
Chevron Slows Permian Growth in Hurdle to Trump Oil Plan
Chief Executive Officer Mike Wirth last month indicated production from the basin will stop growing and plateau in the late 2020s to “really open up the free cash flow.”
This chart illustrates the trend clearly. Reduce CAPEX and give shareholders their dividends and buybacks (or debt repayment).
Exxon isn’t following Chevrons lead (yet):
Exxon pouring $140 billion into the Permian Basin after rise in third quarter production
They will likely be forced to follow Chevron's example of lowering production to extend the asset's life instead of pulling forward production and experiencing higher declines later.
You can see this in Pioneer's (which Exxon acquired) proved reserves, as while they are growing total reserves, they are all NGLs and gas (the crude growth is actually negative).
This is a important metric to keep a eye on with producers in the Permian which in Q4 will report reserve reports. HFI Research and Gorozen have been making the point repeatly that: shale is getting increasingly gassy, a clear sign that the basin is approaching the mature stage.
Increasing production when NGLs and gas are increasing relative to crude just reduces the asset life. Hence, Chevron is dialling back CAPEX and focusing on cash flow to create value for shareholders instead of lighting it on fire like the drill, baby, drill period.
I found this parallel to the 1970s by Gorozen insightful, as it makes sense that productivity rockets as you work through the last of the Tier 1 assets with a decreasing rig count. Then even if oil prices rip higher, you are now dealing with Tier 2 assets, which makes boosting production a lot harder.
Any attempt to substaintialy increase rig count from here will cause new-well production to fall off a cliff or are we now at a a equavilent point to 1980 from Gorozens above history lesson.
Once you've grasped this it is easy to see the holes in these arguments put forward by the likes of Rystad:
Claims of underinvestment in the global oil and gas industry are overblown amid efficiency gains
As a result, many market participants predict that this trend will continue and lead to chronic underinvestment and an oil supply shortage in the coming years. However, our modeling and analysis tell a different story. Lower unit prices, efficiency gains, productivity gains, and evolving portfolio strategies have significantly increased the upstream industry’s efficiency. In other words: the industry can do the same as before, but at a much lower cost. Although investments have shrunk, activity and production remain healthy and on par with the levels seen from 2010 to 2014.
Beside projecting high grading as efficiency gains into the future there are two other points worth noting.
Showing investment spend in nominal terms. You need $122B in 2024 to get equivilent spend of $100B spend in 2020. You can see this with Wood Mackenzie adjusting the below chart to to 2023 terms which chops off $100B or 17% (still below the 22% inflation experience between 2020 and 2024).
The second point is LNG spend getting included with upstream investments when it does nothing to boost the supply of oil & gas.
Lastly, $50 barrel arguments.
Sure, it’s entirely possible it might head there, but it will put the brakes on US production as this will put the majority of North American E&Ps under water on free cash flow. The days of the industry issuing debt and equity like crazy are over (for now), so to maintain free cash flow, they’ll be forced to cut capex, which means high decline rates.
This goes against the belief that some pundits have that US shale producers can breakeven in the $30-40 barrel range. These numbers are usually wellhead breakevens, not full cycle costs. Shale requires a lot of “maintence” CAPEX to delay those declines, let alone grow, before slapping corporate costs and some return to shareholders on top.
As illustrated in the extract from Gorozen above, any attempt to boost production significantly is going to come from Tier 2 wells, and productivity will plumet and costs will explode.
Recent energy surveys would suggest we are seeing the start of this.
Brazil
Brazil's production is the second-largest non-OPEC source of growth. With IEA forecasting a significant ramp from here peaking at 4.6m b/d in 2029.
If you read Petrobras recently released Business Plan Petrobras 2025-2029 it’s pretty clear both forecasts are very optimistic, with Petrobras seeing total production plateauing at 3.2mb/d.
Guyana
Guyana will experience solid growth moving forward, but the 500-600k b/d isn't going to move the needle with the scale of the misses we will see with US and Brazil production vs. forecasts.
Canadia
Canada, while a significant proportion of non-OPEC production, is a nothingburger in terms of future growth. Granted there are some great producer here which just got even more attractive with Trudeau finally been given the boot.
OPEC Spare Capacity
The boogieman for any bullish oil argument is OPEC is ready to dump 5.86 m b/d of oil on the market
OPEC+ members are holding back 5.86 million barrels per day of output, or about 5.7% of global demand, in a series of steps agreed since 2022 to support the market.
I love a good visual, and this one b Amena Bakr does the trick. The most important is the collective group cut, which is a “pretend cut” if you will, as its well above most OPEC members production capacity.
What is the real OPEC excess capacity?
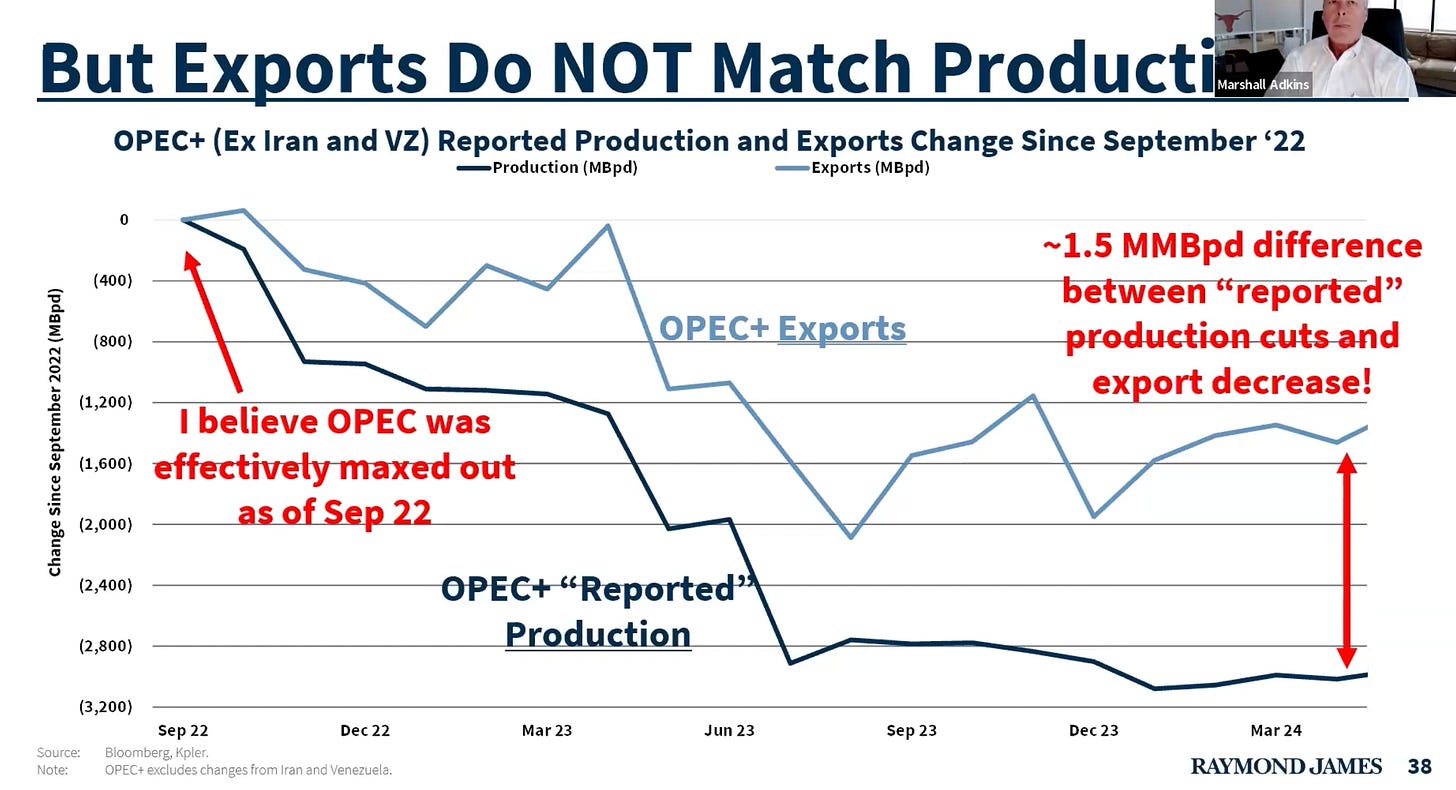
Marshall Adkins pointed out in this presentation on the Haymaker that OPEC countries have consistently overstated their excess capacity to get higher allocations. Marshall believes OPEC was effectively maxed out in late 2022 when they believed Russian production was about to fall. As a result he sees OPEC excess closer to 2.5M b/d.
Interestingly, Marshal also sees a large gap between exports and OPEC+ reported production.
I’m not smart enough to work out what the real excess is but believe its a lot lower than most analysts would have you believe. Also the OPEC+ disunity narrative the media has been pushing is far from reality.
I see the opposite of the headlines below: As US production stalls, OPEC+ will be back in the driver's seat.
Regarding Trump sanctioning Iran oil it will likely have little effect as the oil will still flow to China and Trump will get commitments from OPEC to increase production and exports to compensate for the loss of Iranian oil.
Main Supply Takeaway
The non-OPEC oil growth forecast is going to miss in a big way. In particular, shale growth stalling means OPEC's spare capacity will be worked through this year before things get very tight heading into 2026.
The Case for Offshore Services
Honestly not a whole lot has changed since I wrote this piece Offshore the Future Oil Supply Story other than utilisation has stalled and oil price and sentiment is in the toilet (along with the companies).
A boom in offshore oil is predicated on shale hitting the limits of its growth. Otherwise the rational thing to do is choose the source with the 2 year payback and highest IRR.
Shale growth is in the process of stalling out which makes deepwater offshore the most attractive source of new supply on payback, IRR and breakeven.
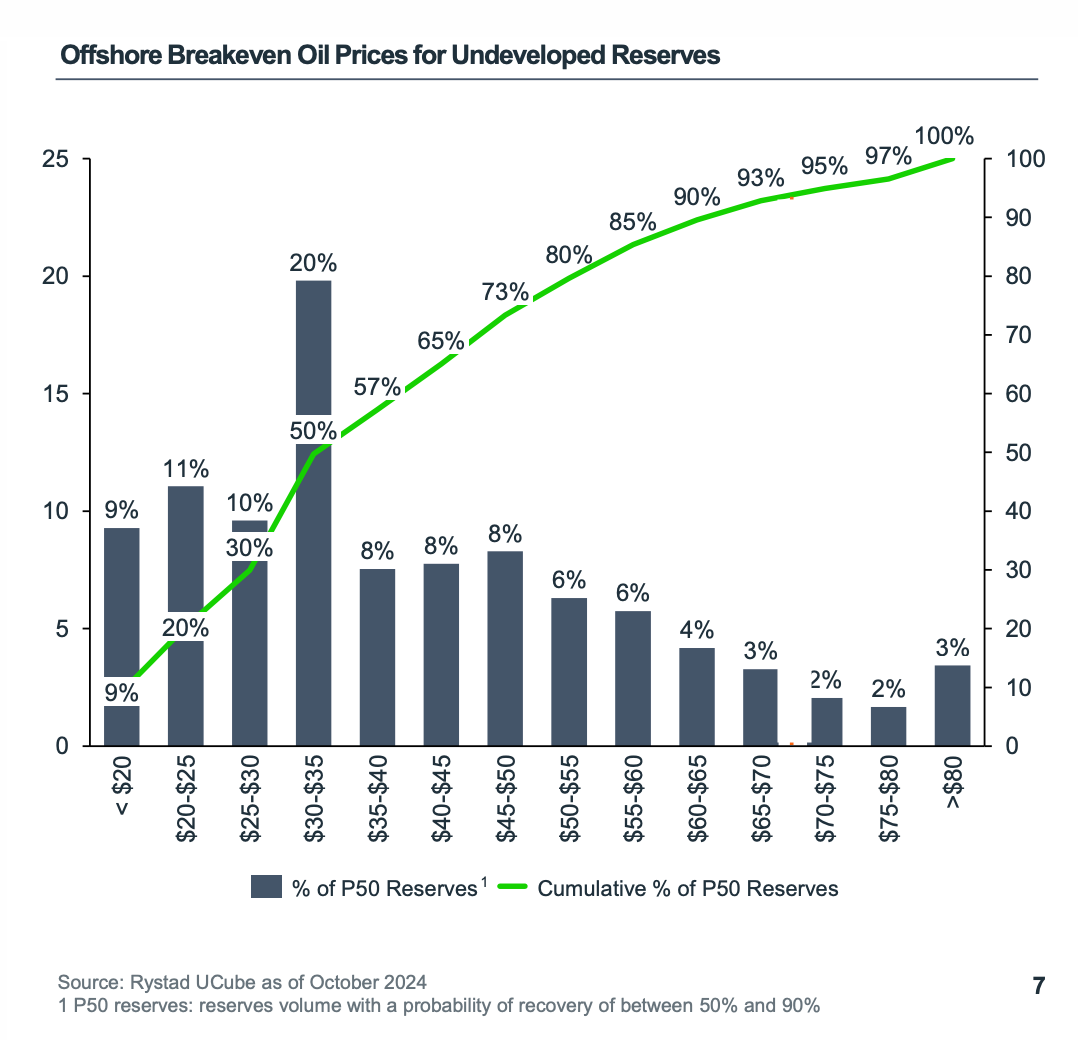
Shale breakevens are going to continue rising as the Tier 1 assets have been worked through, making offshore increasingly attractive. With offshore, around 50% of undeveloped resources are profitable at $30-35 barrel.
Long Cycle Assets
As reality continues to steamroll Net Zero forecasts, we are nearing the end of this game of make-believe, and companies get back to making multidecade investment decisions, of which deepwater offshore is the main beneficiary. The failure of green policies means the demand for fossil fuels must be revised up.


