Three Buckets of Asymmetry
Where is the relative value now? Buying a new position in a new industry.

I’ve seen the recent rally described as the 2025 Junk Rally, Reversion to the Meme, or, my favourite, as Brad labelled it, “The flight to shit.”

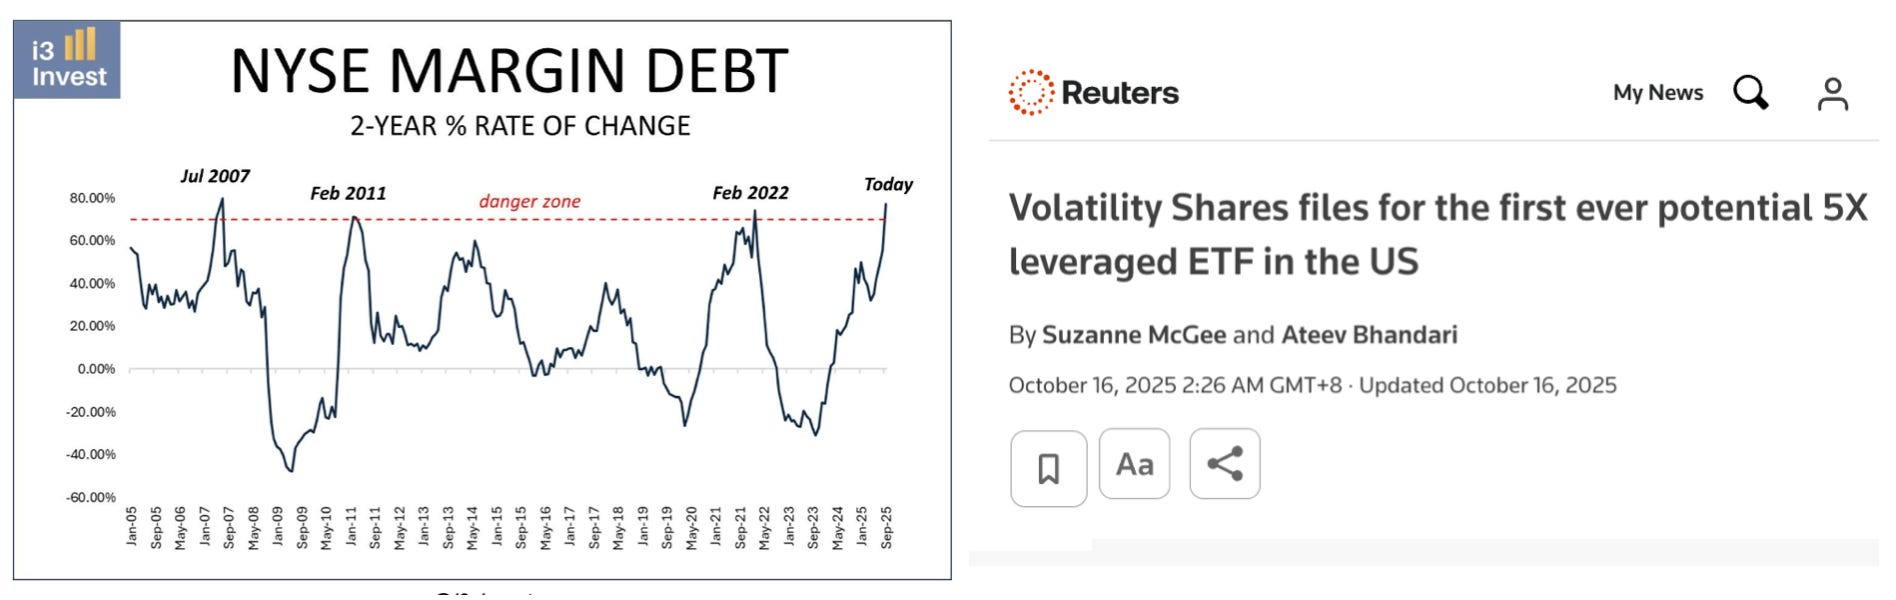
If you’re not getting uncomfortable watching margin debt match Feb 2022/July 2007 levels while 5x levered ETFs get launched on crypto and meme stocks, then you’re not paying attention.
Granted, observing this is one thing; knowing when it will end is another.
The dial will get spun to the opposite extreme at some point….

This brings me to my three buckets with which I’m viewing my portfolio.
Precious Metals/Debasement Trade (Gold, platinum, rhodium and associated miners).
Bottlenecks/supply constraints (Uranium, tin, oil, coal and derivatives in miners, producers, services, rigs, OSVs etc).
Asian Boom (Chinese tech, small cap asian equities).
Yes, it’s an oversimplification, as there is a ton of overlap between the buckets (I could easily put platinum/rhodium in bottlenecks due to their industrial demand drivers, and coal could go in the Asian Boom bucket).
This is all a mental exercise in assessing the relative value of the three buckets and at what point I should reconsider rebalancing.
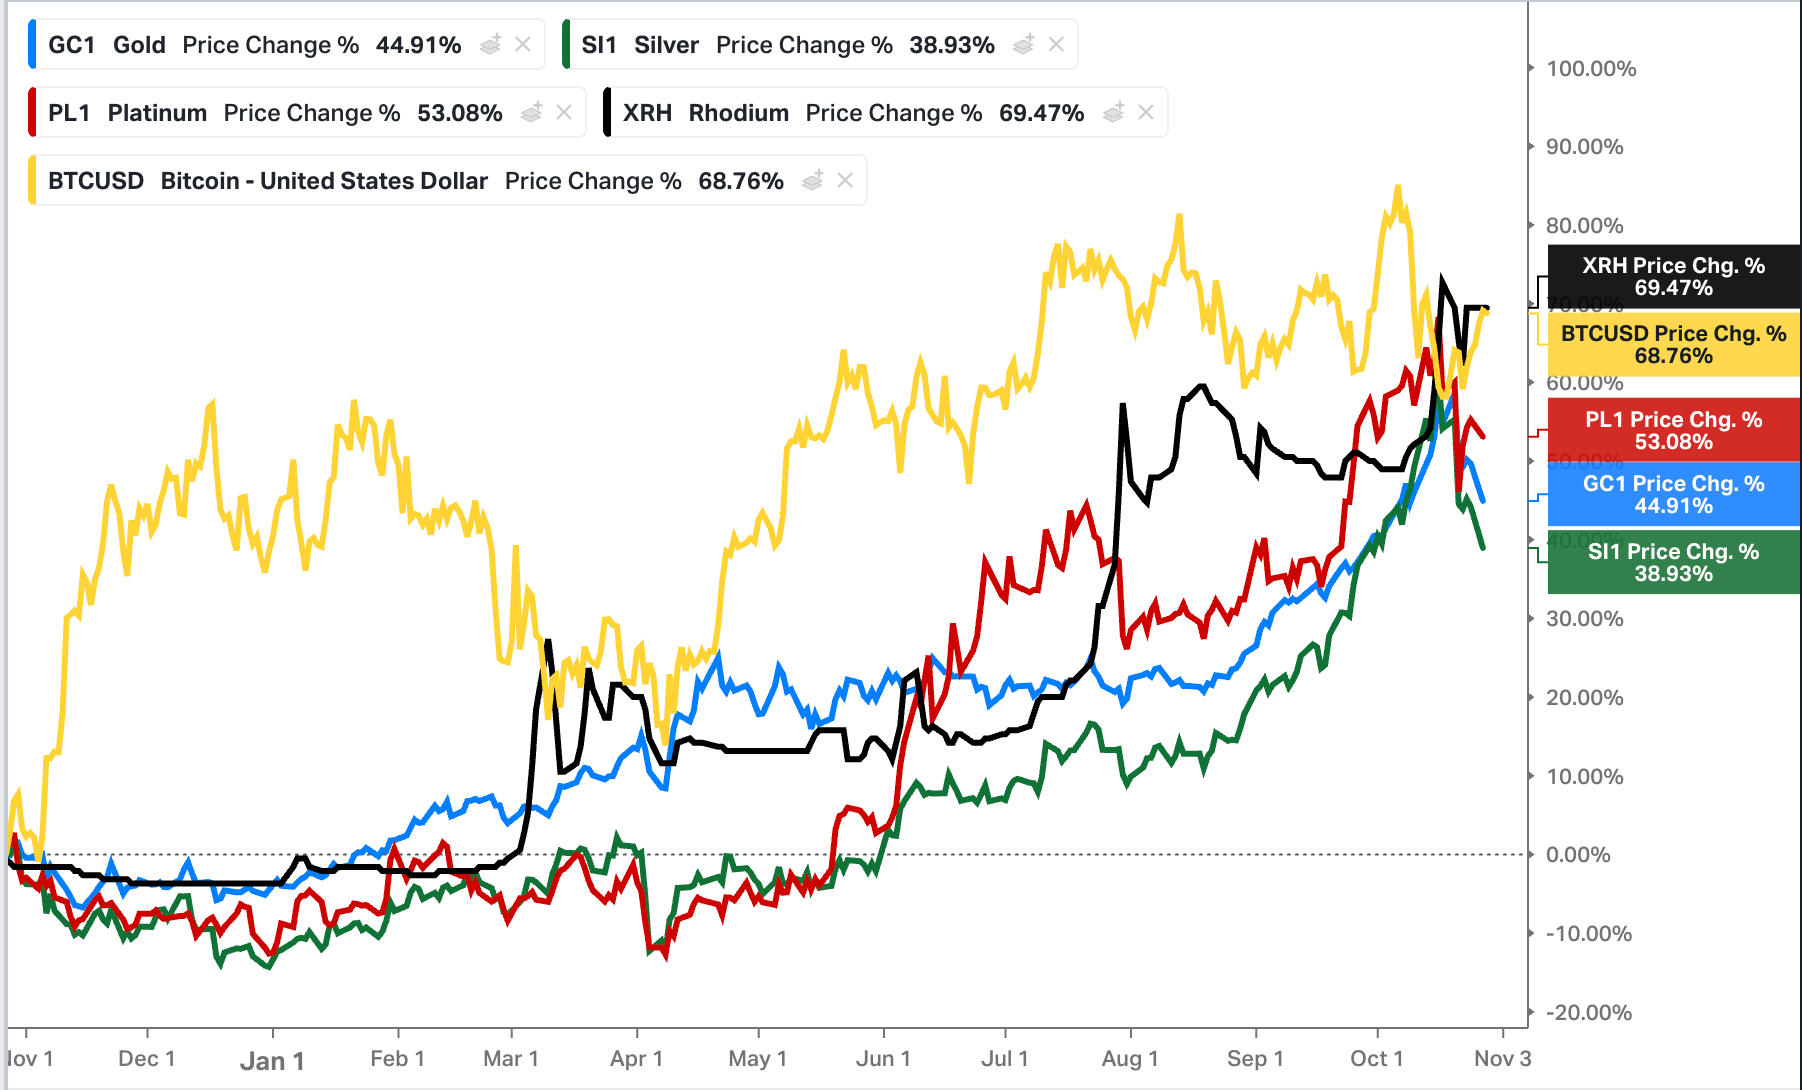
If you run performance over the past year in the PM/debasement bucket whether you were in gold, silver, platinum, rhodium (or even bitcoin), you’ve done just fine even with the recent pullback. Assets with leverage to these, i.e., miners, have experienced solid outperformance.
The current pullback in gold, silver, and platinum is healthy; nothing goes up in a linear fashion (except Ponzi’s, for a while anyway). Observing something is overextended or overbought is one thing; the more important questions are:
Overbought relative to what?
What’s your timeframe?
Sell it to buy what?
There are no riskless options; it’s a paradox in what has historically been considered low risk, i.e, a 60/40 portfolio is high risk in my eyes, as I don’t like the long-term risk-reward for the S&P500 or long-dated treasuries.
Howard Marks summed up the outlook for the S&P500 is in The Calculus of Value.
At the time, J.P. Morgan published a graph showing that if you bought the S&P 500 index at 23 times the coming year’s earnings per share in the period 1987-2014 (the only period for which there’s data on forward-looking p/e ratios and resulting ten-year returns), your average annual return over the subsequent ten years was between plus 2% and minus 2% every time. To the extent this p/e ratio history is relevant, it bodes pretty poorly for the S&P 500.
I see long-dated Treasury holders getting even more brutalised on a real basis.

Yes, selling something to sit in cash gives you optionality, but it also comes with a high opportunity cost, especially when there is a lot of value around.
I’m all for trimming/selling your gold or platinum if what you plan to buy looks cheap in gold/platinum terms and provides a superior risk/reward.
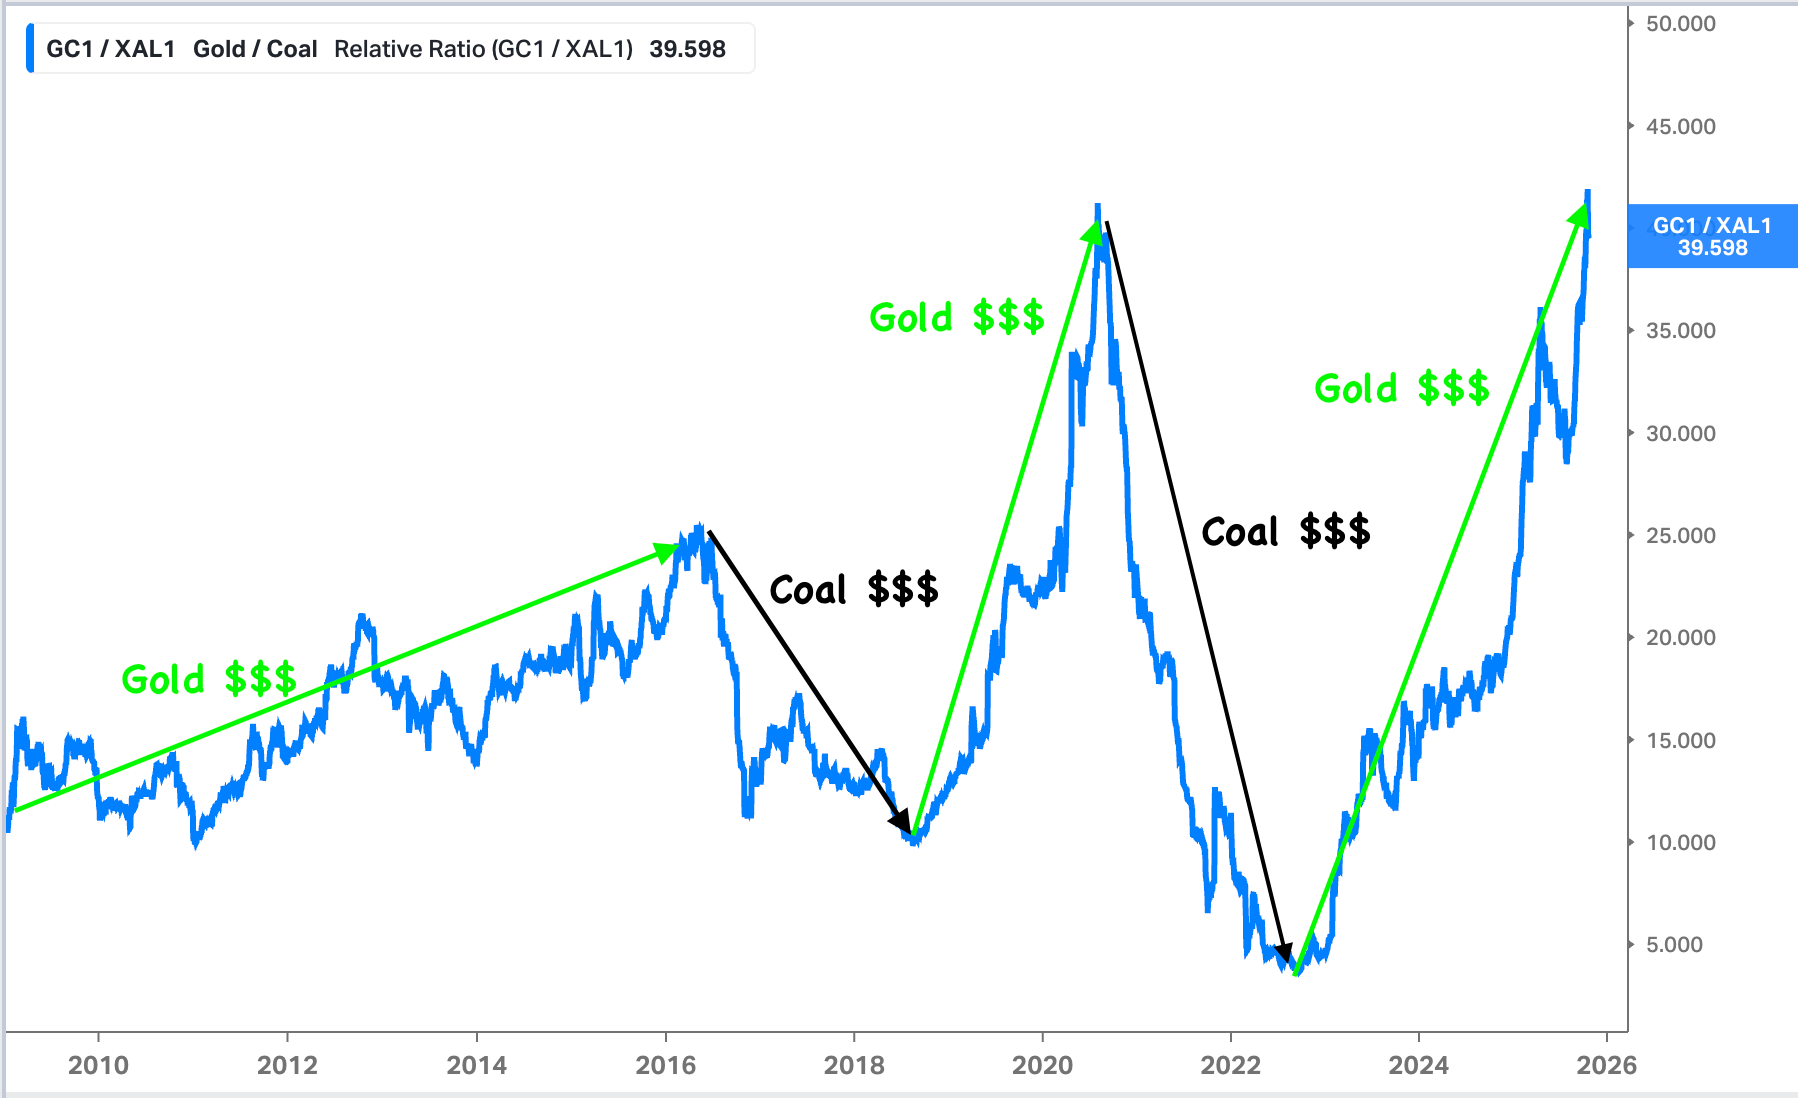
The wildest example I’m aware of is the gold-to-coal ratio. I mean, who would be crazy enough to sell some gold to buy coal companies here?
What’s your timeframe?
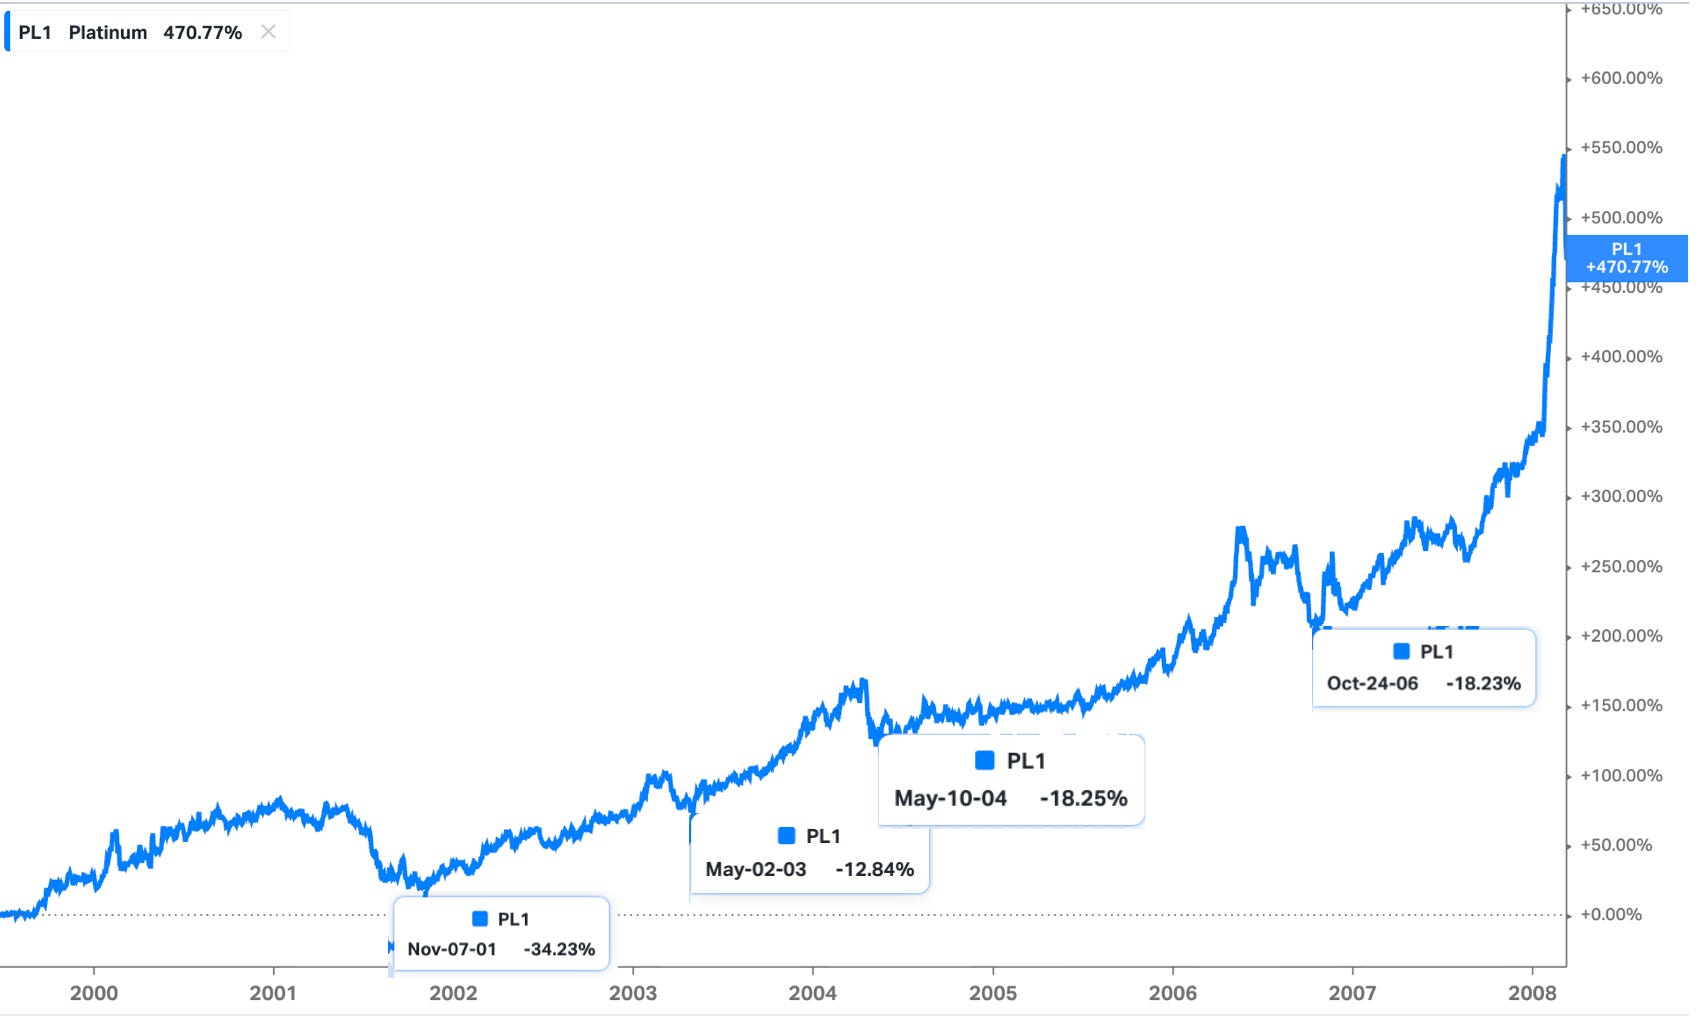
I love the chart below, as we are in a structural bull market for precious metals, with platinum set to repeat its performance in the early 2000s.
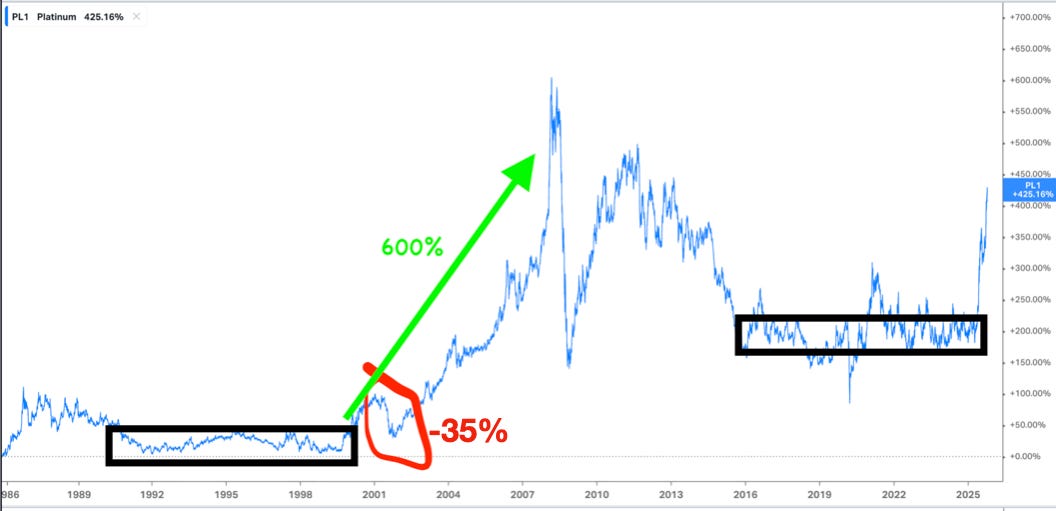
With this view any pull-back is a buying opportunity.
Sure, if you are a great trader, you can dodge some of the drawdowns along the way. I’m under no illusions I can time them, so I’m going to stomach the volatility and hope I have a bit of cash to deploy if we do see a sizeable drawdown (like November 2001 in platinum).
Similar to the passive mantra of you dollar-cost average and buy every dip, I feel we are in that regime for platinum and gold.
Things are running hot on the sentiment side, even with the pullback, which means gold and platinum are the last buckets I’d add incremental capital to here.

How about the miners?
My gold and PGM miners have been the best-performing corner of the portfolio, and I’m happy to stomach the recent volatility as this PM bull market is only just getting underway. At the same time, it’s likely a while before it matters, a lesson from past mining cycles to be careful about extrapolating miners’ margins.
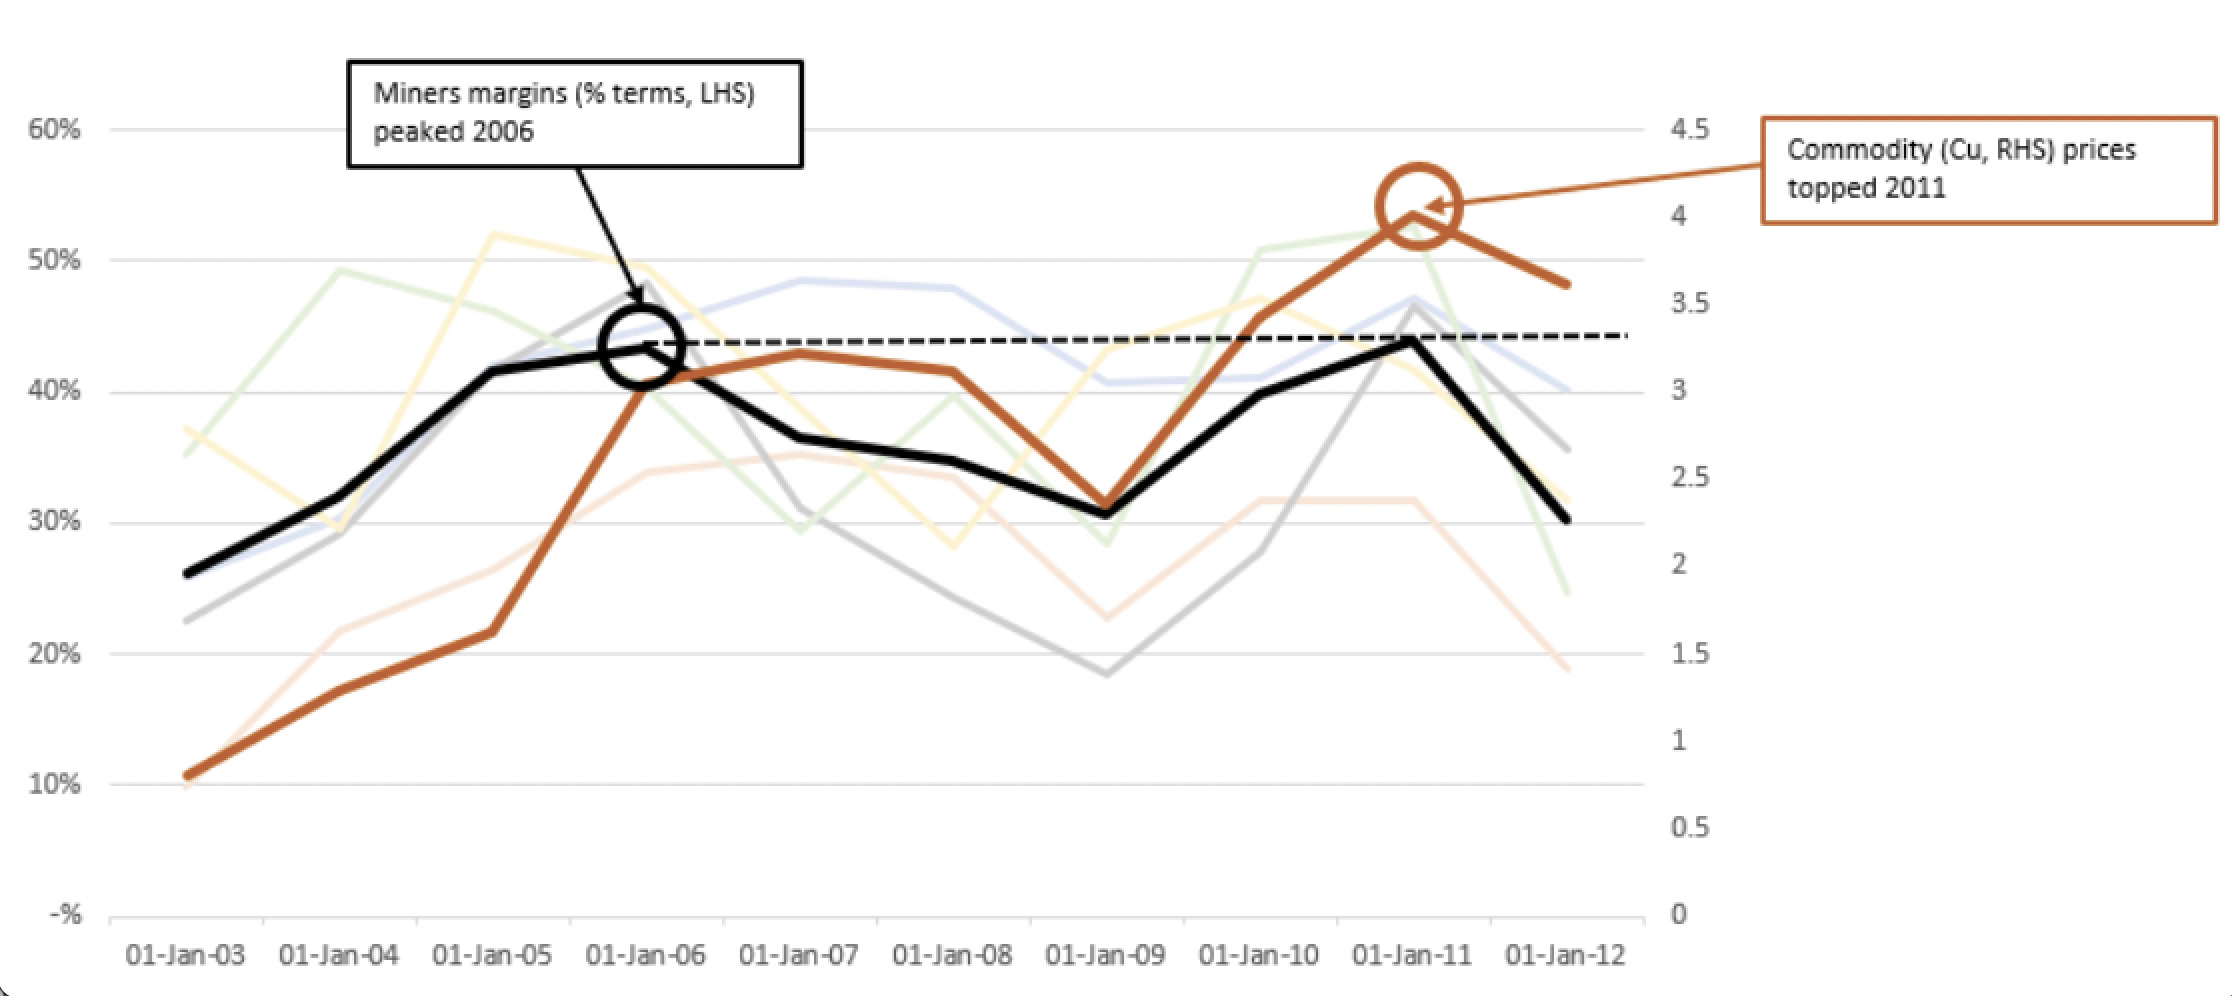
This is a great case study on the topic PWC Mine: The growing disconnect.
Structural cost base transformation (underwritten by rising production costs and declining ore grades)
Declining ore grades drive costs higher (classic high grading).
Operating expenses outpaced revenue growth (In 2011 cost growth exceeded revenue growth despite surging commodity prices).
Contractor costs surged due to skilled labour shortages.
Fuel costs jumped 39%
Margins remained flat despite record profits.
CEOs believe rising costs are permanent: Mining industry CEOs expressed the view that the trend of rising costs is structural and permanent rather than cyclical.
Cost inflation sets higher commodity price floor: As cost bases continue to increase across the industry due to lower grades, labour shortages, and input cost pressures, the floor for commodity prices will continue to rise, fundamentally changing the economics of mining operations going forward.
The takeaway is that there’s a window to own miners —just don’t overstay your welcome.
I see history rhythming with a combination of skilled labour shortages, high-grading, and rising fuel costs, impacting margins.
A recent example is Cameco, citing limited access to skilled labour, yet dozens of aspiring uranium producers don’t seem to see it as an issue…
Understanding the above can help you rotate capital from a sector where margins are peaking to the very sector that stands to benefit from margins peaking (energy prices running).
I’ll start trimming to rotate the capital from an area where investors are popping champagne to one where they are holding their nose at the mention of the road-kill, such as with the seismic space.
The Bottlenecks/Supply Constraints
(Uranium, tin, oil, coal and their derivatives in miners, producers, services, rigs, osvs etc).
While oil & seismic exploration still take the crown, for the most hated, Chinese equities aren’t too far behind.
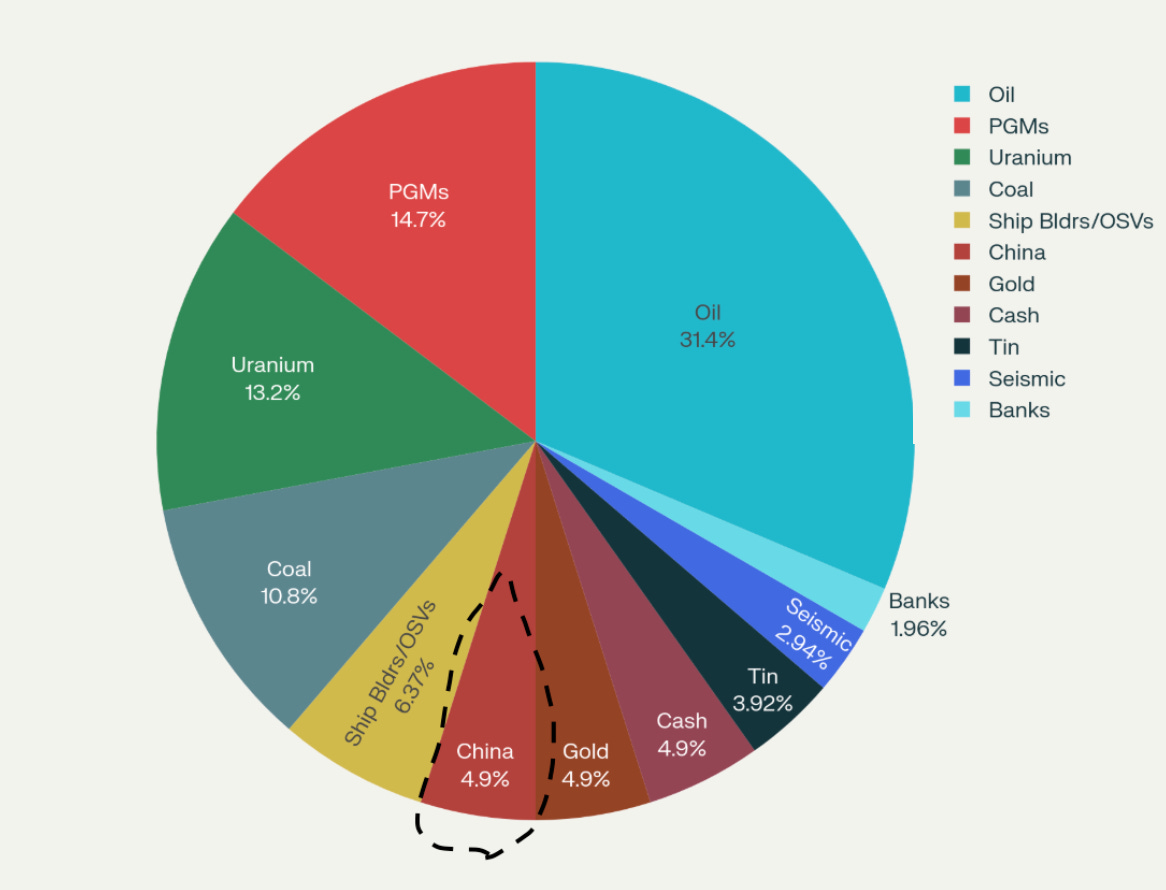
I started writing about oil, but decided this piece is long enough, and I really want to focus on the bucket that is severely underweight. Yes, it’s not that clean-cut: coal, PGMs, tin, oil, and uranium are all tied to the Asian boom thesis, but even with that rationalisation, this weighting feels silly.
PM/debasement 20%
Bottlenecks 75%
Asian Boom 5%
The Asian Boom Bucket
I laid out the thesis here, The Coming Asian Boom and my positioning in these two pieces (Hated Tech? and Hated Tech 2.0).
I want to touch on a few more points I didn’t cover adequately in my previous pieces:
Don’t Fight the
FEDPBOCEnergy + AI + Robots
Asian Boom thesis
Chinese Buyback Support
Everyones Underweight
Risks overstated
Correlations to the rest of the portfolio
Positioning
Don’t Fight the FED PBOC
I loved the parallel Louis Gave drew to the US in 2009 in this interview (time stamped).
“China’s now in an environment where there is no inflation. The constraint to stimulus is always inflation, right? There is no inflation in China.
China is not that far off where the US was in 2009/2010, you know, inflation collapsing, low real estate prices, very low confidence. So you can follow very loose monetary policy, and if you choose to, very loose fiscal policy, and this is where China is today.
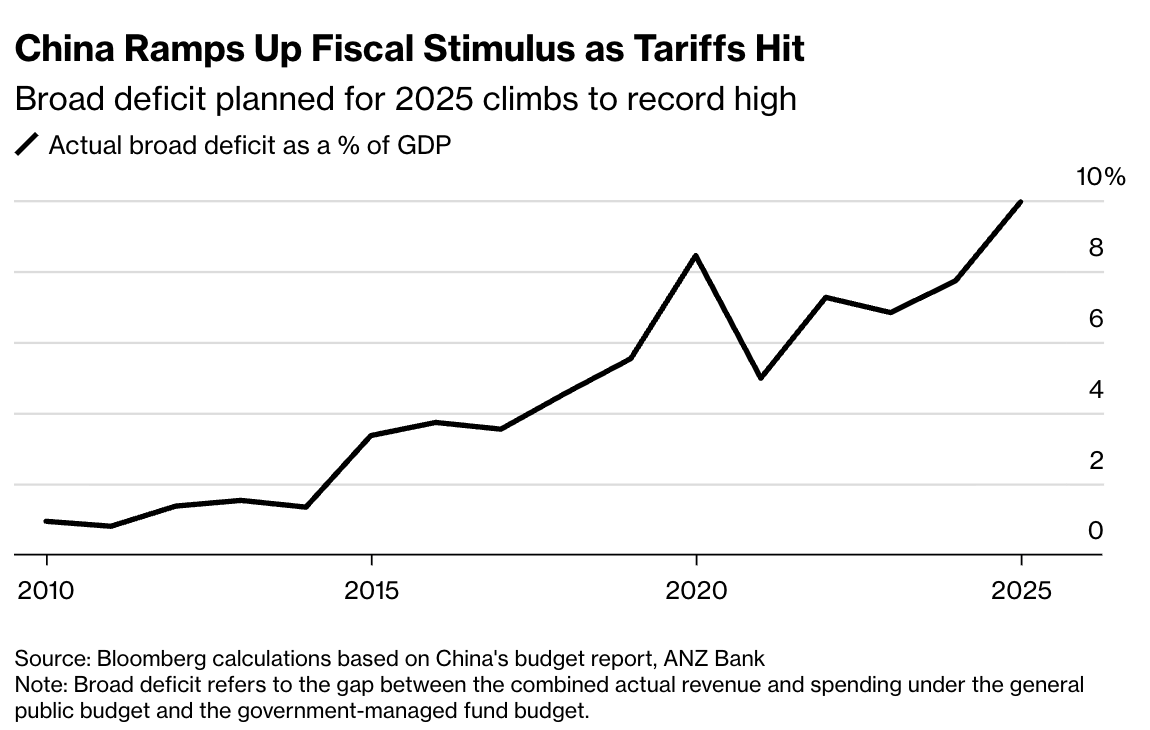
China right now this year will probably be running budget deficits of around 10% of GDP, give or take, China’s never run budget deficits this big. This is this is absolutely massive. They’re doing this at a time when monetary policy has never been this easy.
So you’re seeing massive, massive liquidity injections and for now, because economic growth isn’t that strong, you’re in an environment not that dissimilar to what you had again in the US 2009/2010 where you’re pushing excess liquidity in and the default mode is for that excess liquidity to find its way into asset prices, most notably equity prices.”
Most commentary I read on Chinese equities questions the sustainability of the rally, “another false dawn”, or quickly dismisses it on the basis that you’ll get rug pulled in a similar way to Russian equities (a point I’ll get to).

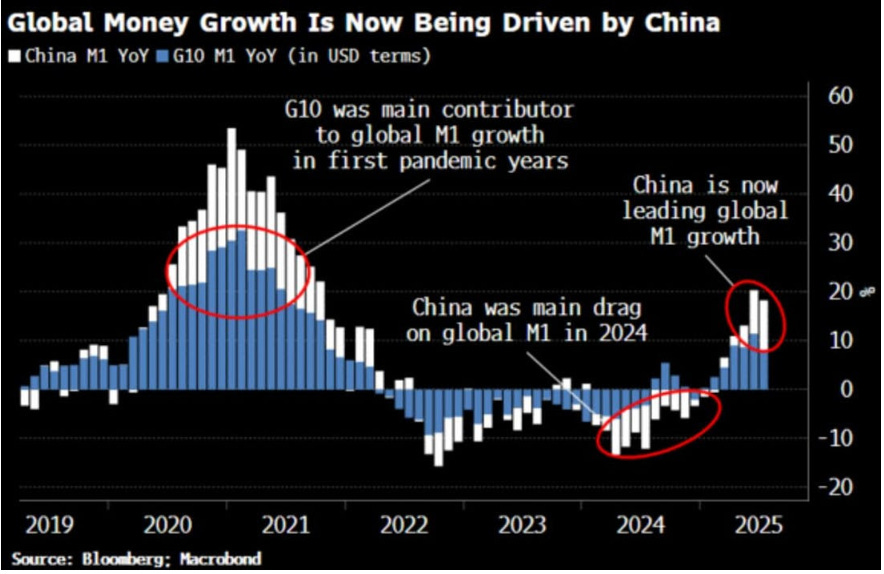
Western investors are well versed in the effect of money supply growth on equities. What is going to happen now that China has shifted from being a drag on money supply growth to a driver of it?
Energy + AI + Robots
This section in the Electric slide caught my attention, and when you consider China’s vastly superior position in electricity generation and manufacturing/robotics, they look to benefit from AI to a far greater extent than the US.
“There are only really three pillars to anything around us, as far as consumable goods. We’ve got energy, intelligence, and dexterity.”
I would generalize “dexterity” to “action.” Everything we see around us, and will see around us in the future, is the result of the potential to do work (energy), the capacity to decide what to do and how (intelligence), and the ability to manipulate matter (action).
In economic terms, energy, intelligence, and action are strong complements in the production of anything.
And in the immortal words of Joel Spolsky, “Smart companies try to commoditize their products’ complements.”
America is, implicitly or explicitly, making a bet that whoever wins intelligence, in the form of AI, wins the future.
China is making a different bet: that for intelligence to truly matter, it needs energy and action.
If you control energy and action, making intelligence abundant strengthens your position.
China has 55% of global robots (Asia has 76.5%), and has grown from the same generation as the US in 2010, to now generating 150% more than the US.
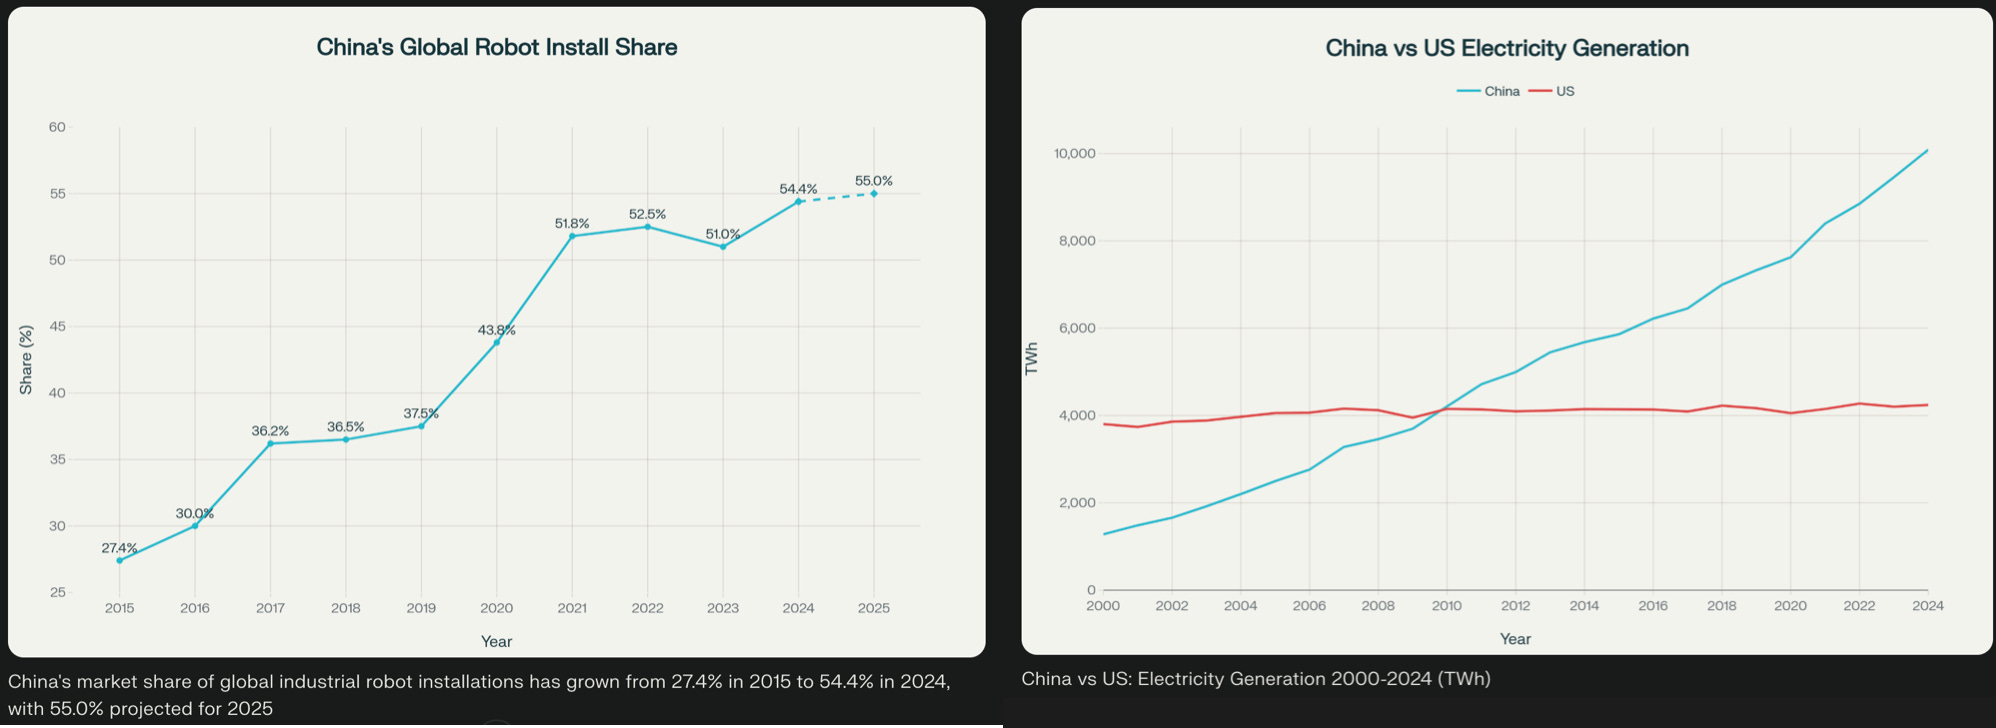
These figures don’t do justice to China’s dominance in robotics either, as its domestic robotics production is now at 47% and robotic use across industries is quite broad-based.
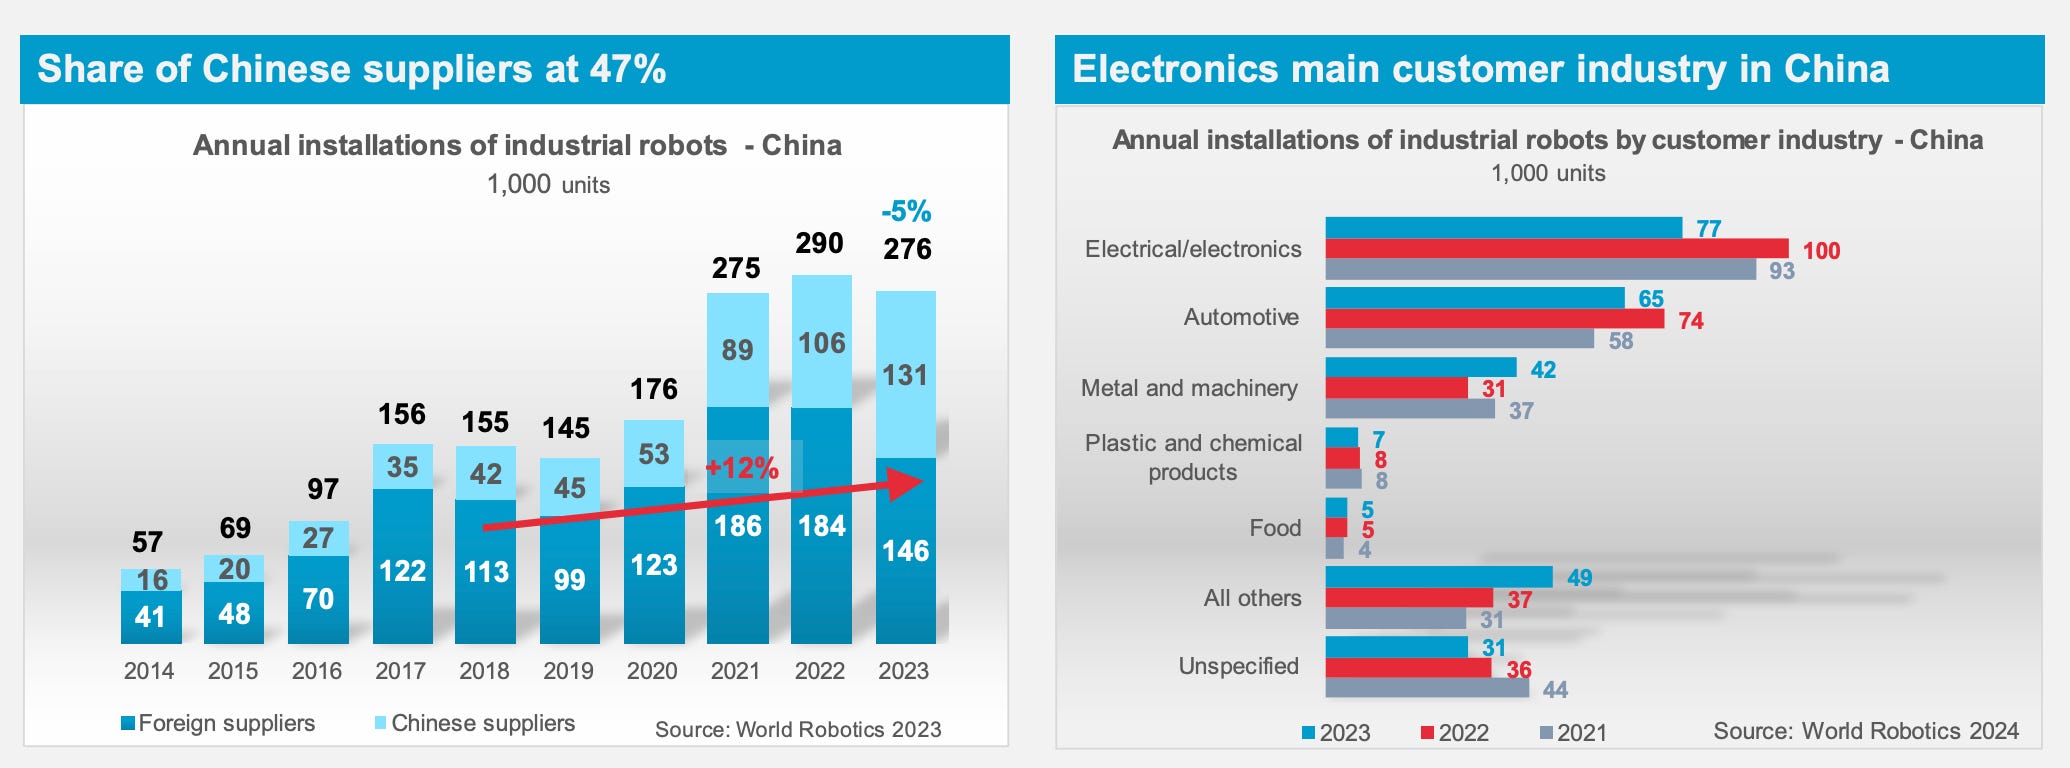
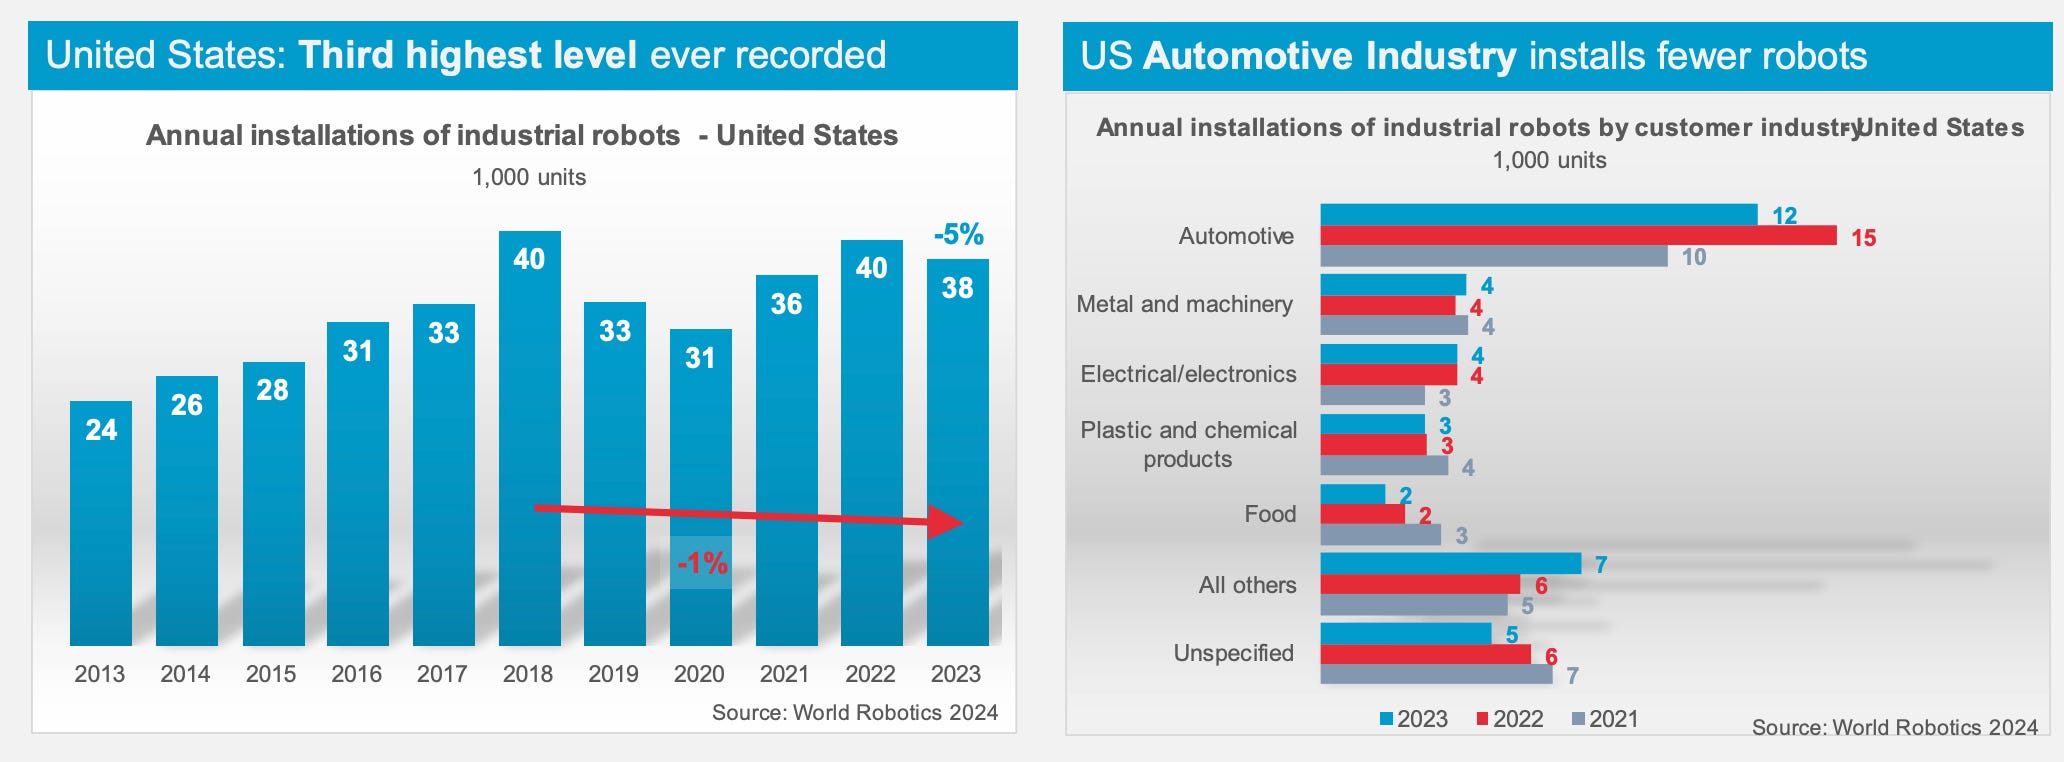
Compared to the US, where installations are a fraction (14% in 2023) of China and highly concentrated in automotive, where they can’t compete with Chinese autos globally anyway!
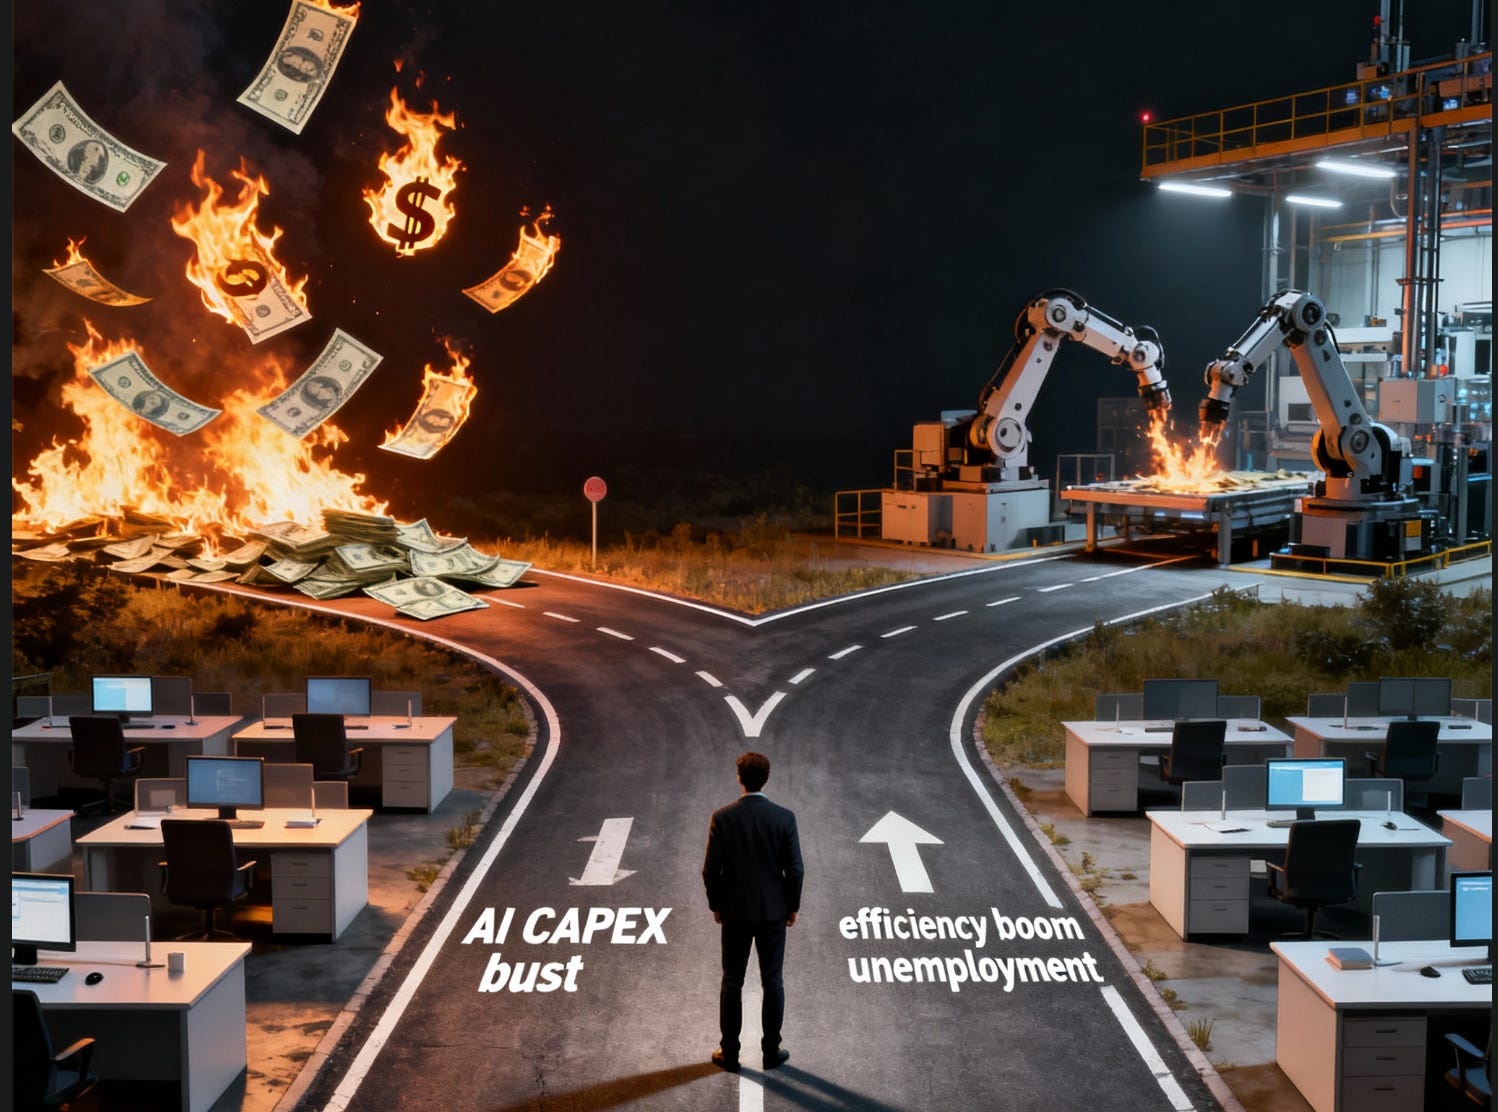
Since the US focused on winning intelligence, they face a double-edged sword: if intelligence delivers massive productivity gains, it will damage employment in the US’s service-heavy economy, while if it doesn’t deliver, the resulting AI CAPEX bombfire will do serious damage to US tech-heavy markets.
When I’ve mentioned Cathie Woods, it’s usually to dig into the assumptions behind her “exponential growth opportunities.”
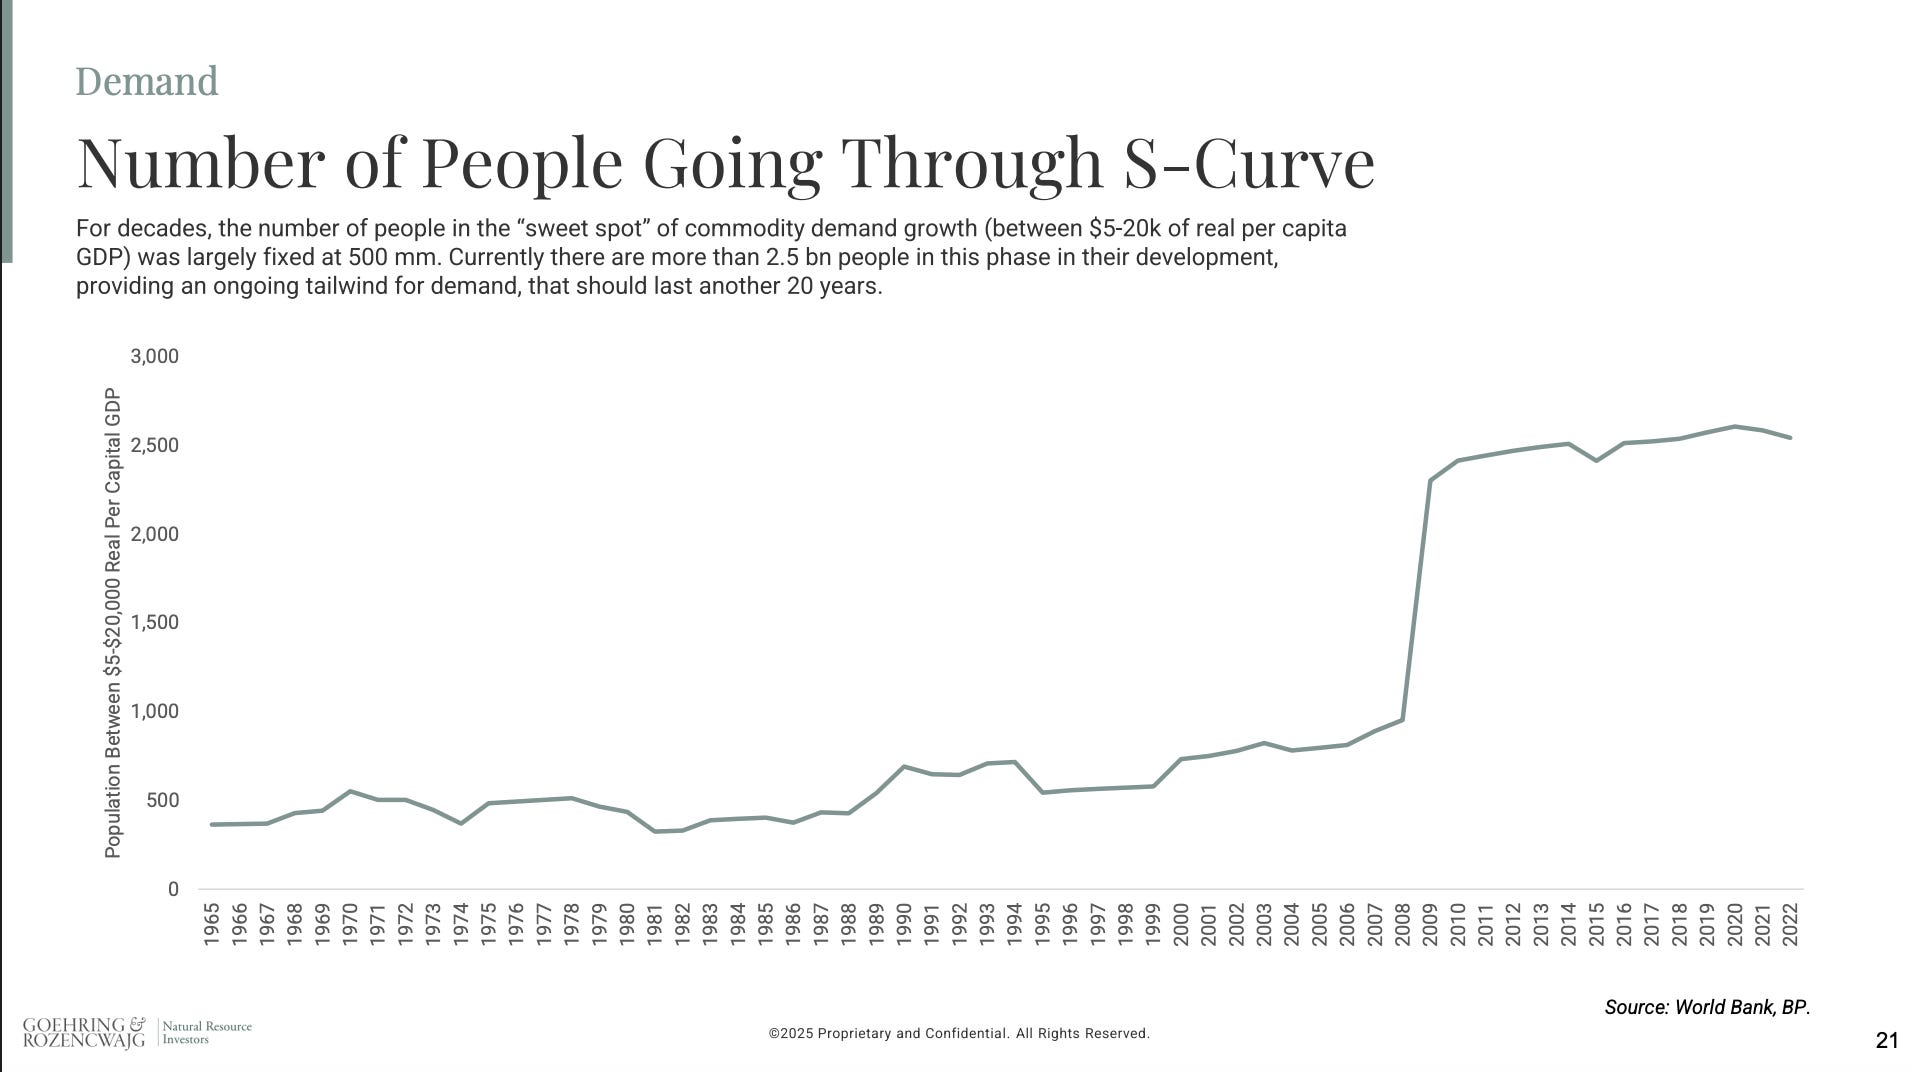
Technology Convergence Creating Explosive Growth: Wood emphasizes that the convergence between AI, robotics, and energy storage is creating exponential growth opportunities, particularly in autonomous mobility and humanoid robotics where “one S-curve feeds another S-curve”.
-Cathie Woods
While Cathie is talking her book with US companies in the quote, the “one-S curve feeds another S-curve” statement is more fitting with where Asia finds itself.
Asian Boom thesis
Since writing The Coming Asian Boom, I have continued to see the evidence mount.
I mean this month alone we have seen these two announcements.
October 2025 India-Russia: Yuan for Oil Value: ~$5B annually
October 2025 BHP-China: Iron Ore Yuan Settlement Value: ~$9B annually
This is a tailwind you want to ride for the next decade.
The removal of the US dollar handbrake
The other side of the US running large deficits and over-consuming has been Asian countries running surpluses to ensure they have the US dollars to buy the commodities/energy they need.
Asia’s oil import dependency is ~81% so increasingly being able to purchase their energy needs in their own currency takes the handbrake off their ability to grow more rapidly (boosting consumption and trade with each other).
Chinese Buyback Support
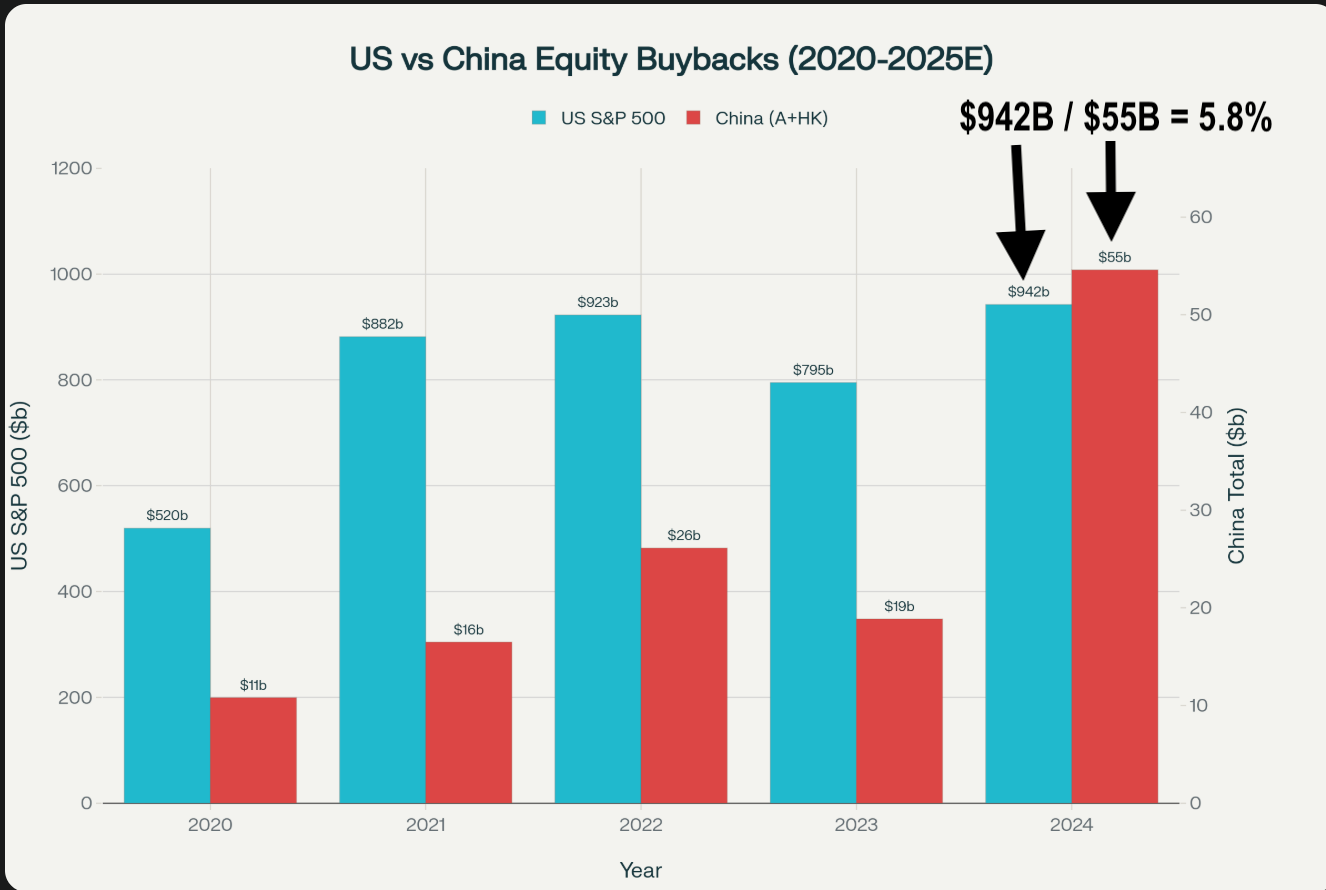
It’s always a good idea to pay attention to what Chinese banks get behind: Chinese Banks Can Now Lend Up to 90% for Stock Buybacks via Relending Facility, Sources Say.
As sure it’s a fraction of US buybacks, but it’s the trend that matters, and it’s just getting warmed up! Buybacks have played no small part in tech’s outperformance, with Apple having brought back a third of its shares outstanding and Meta and Alphabet both having brought back 11-12% the last 5 years.
Everyones Underweight
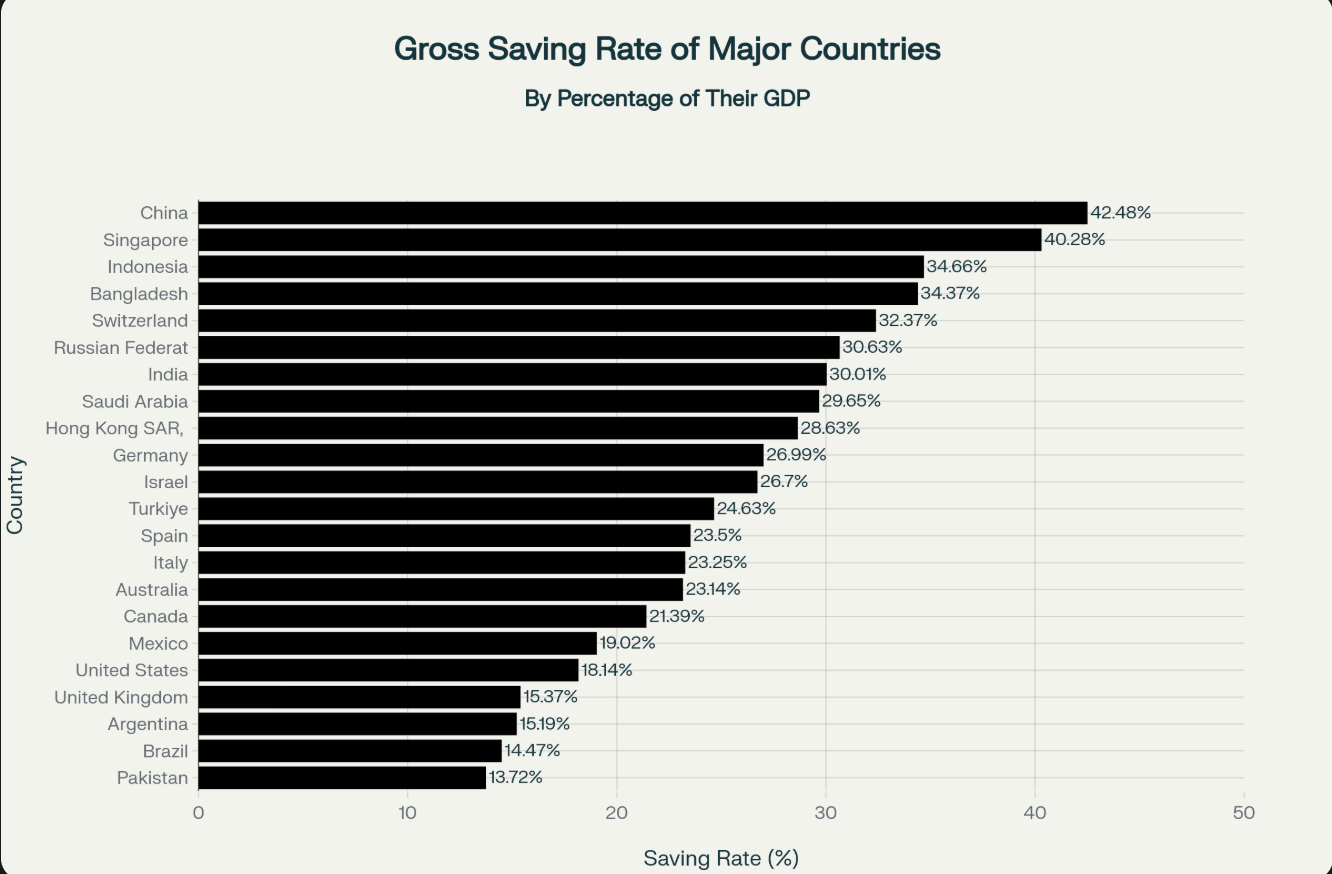
There is an awful lot of dry powder on the sidelines in China.
The Untapped Potential of Chinese Household Savings as a Catalyst for Sustained Stock Market Growth
The allocation of these savings has historically been skewed: 60% in real estate, 25% in deposits, and a mere 5% in equities.
Yes, I fact-checked that: only 5% of Chinese Households own equities vs. 38% for US Households (depending how its calculated).
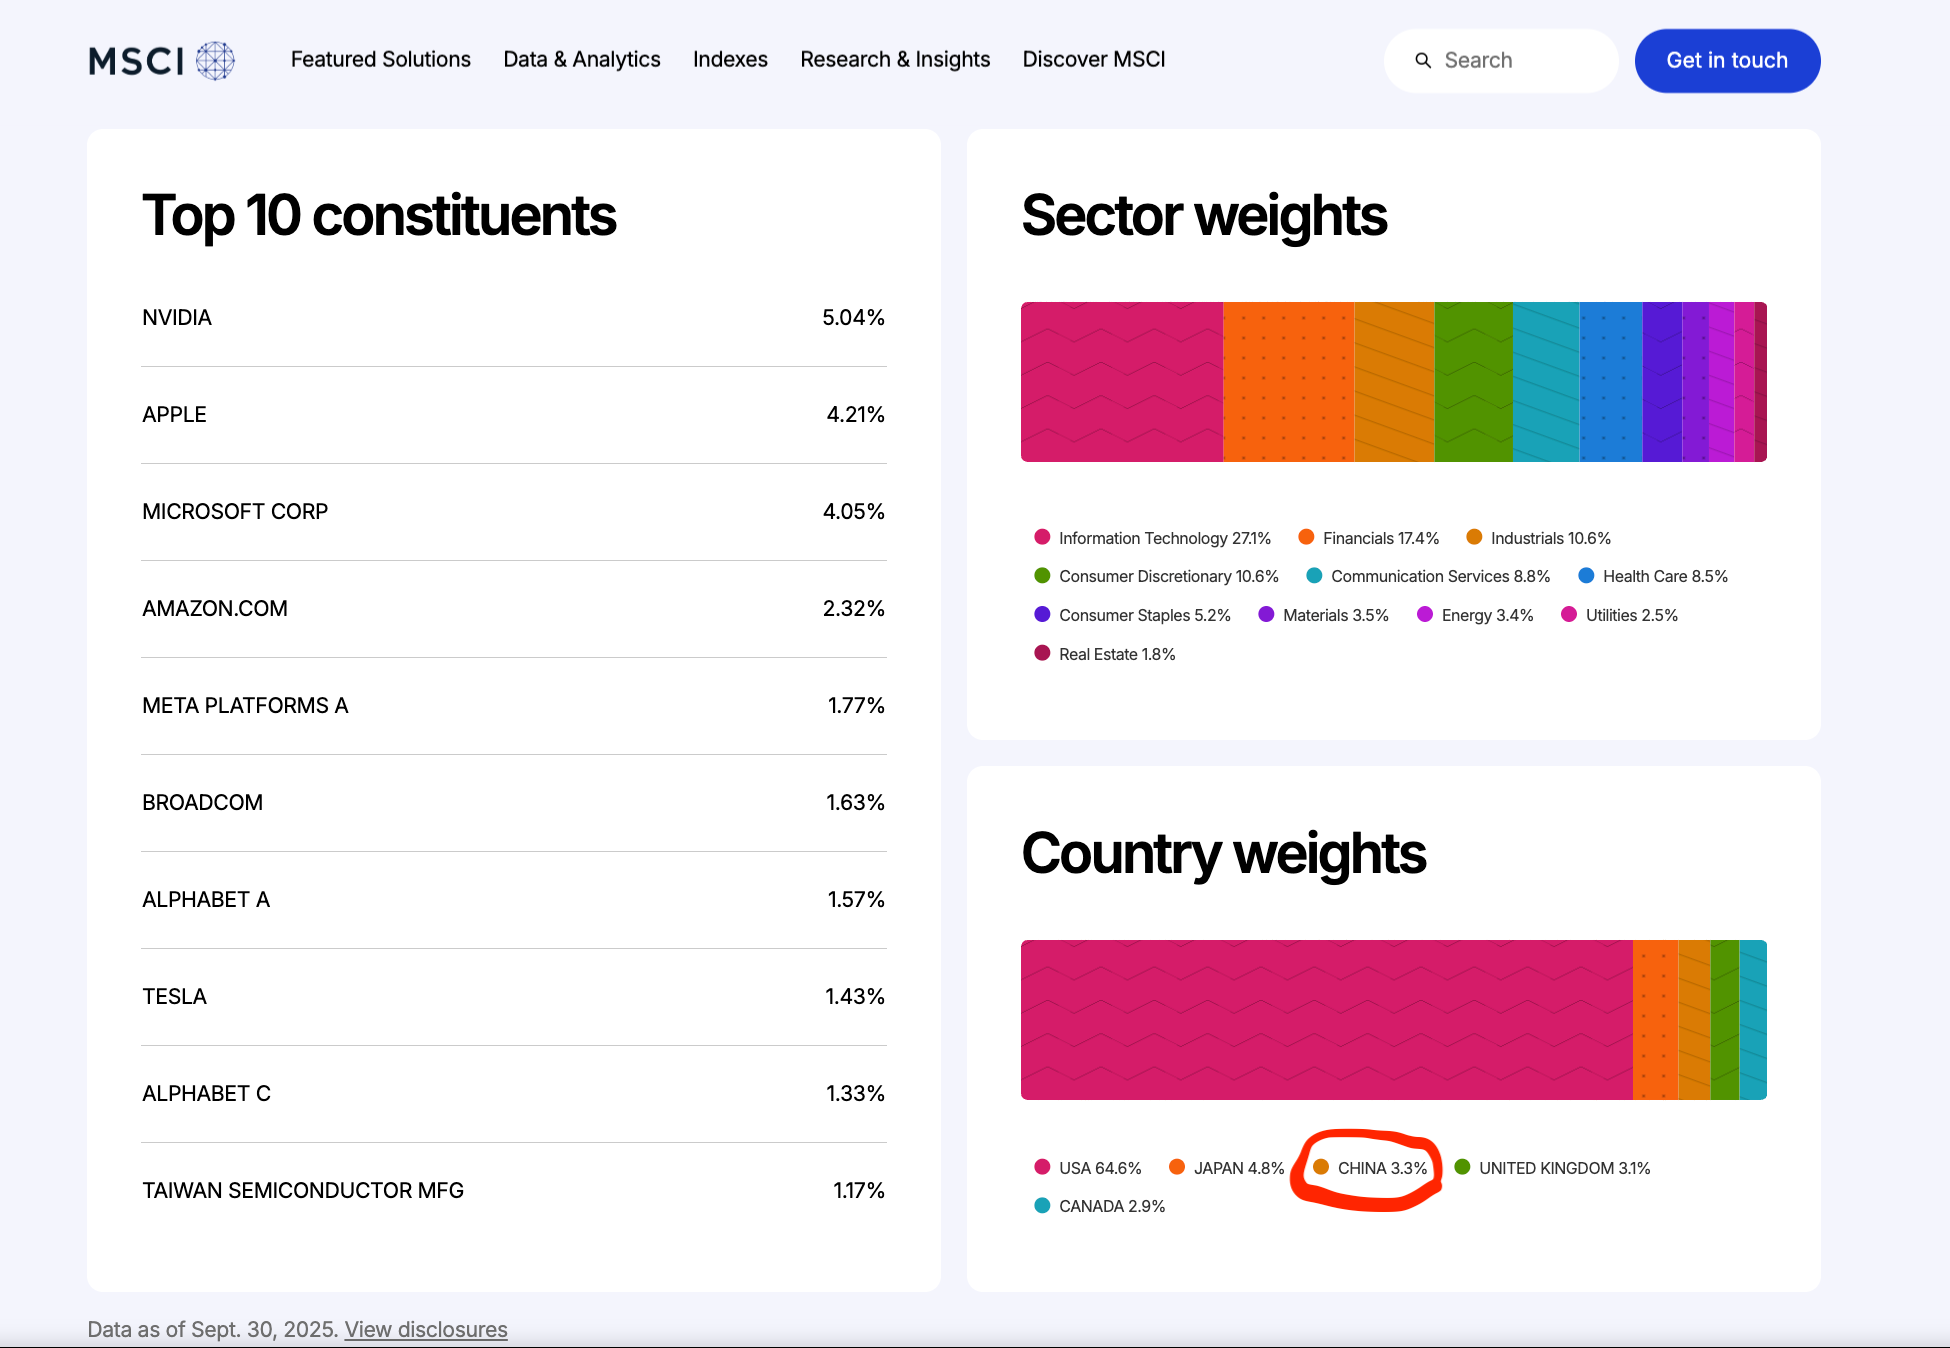
Whether you look at Chinese citizens’ allocation or global equity allocations, all are massively underweight China.
I mean the MSCI ACWI, which “captures large and mid cap representation across Developed Markets (DM) and Emerging Markets (EM) countries”, has 3.3% weight to China and 20.4% MAG7.
Risks are overstated
The knee-jerk response to a heavy weighting of Chinese equities is the risk of a rug pull, similar to what happened with Russian equities following the sanctions.
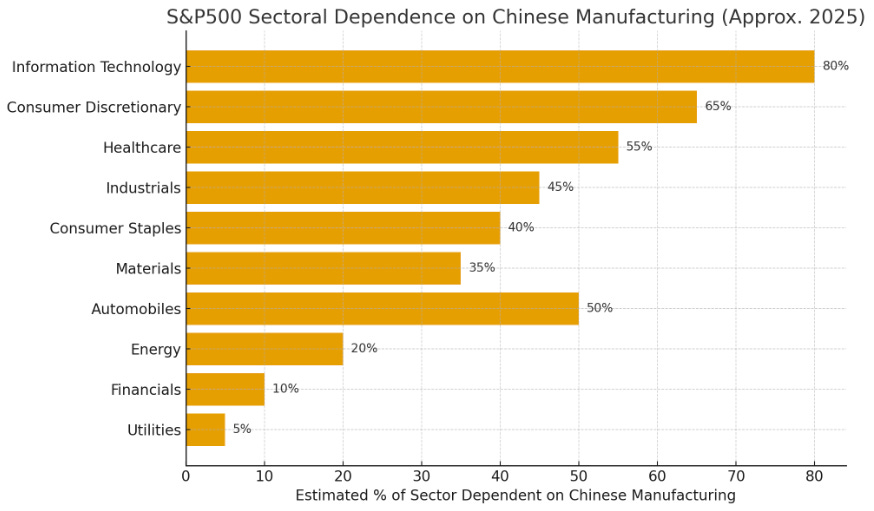
The scenarios couldn’t be more different: ~1% of US companies were in some way integrated with Russian companies at the time of sanctions. With China, roughly 45–55% of S&P500 by company count rely in some way on Chinese manufacturing capacity. I mean, take Apple, where Trump couldn’t maintain tariffs, let alone full sanctions: Trump exempts tariffs on iPhones, computers and chips.
“De-risk but not decouple”
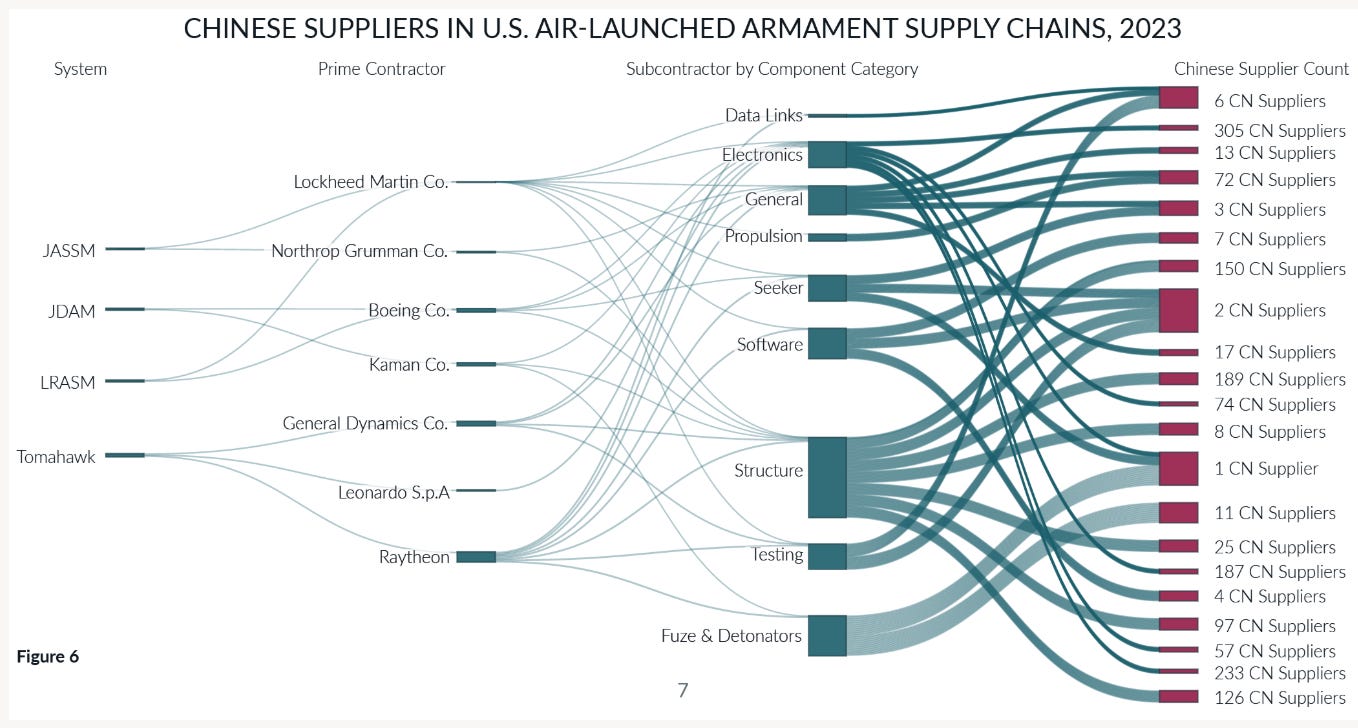
The extent of the US military complex’s entanglement with China was the most telling.
Greg Hayes, chief executive of Raytheon, said the company had “several thousand suppliers in China and decoupling . . . is impossible”. “We can de-risk but not decouple,” Hayes told the Financial Times in an interview, adding that he believed this to be the case “for everybody”.
Making matters worse, a lot of EM manufacturing is final-assembly but core inputs still come from China. Companies list “Asia” or “EM supply chain” rather than naming China directly.
Legally, if 51%+ of value-add is outside China, it ceases to be reported as “Chinese-origin,” but precursors still come from China — especially in batteries, rare earths, pharma precursors, semicon packaging.
A similar point was made in this piece on how US GDP doesn’t take into account foreign parts: How GDP Hides Industrial Decline
Current Manufacturing Statistics Don’t Track What Actually Matters - Existing metrics fail to measure the percentage of components actually made in America versus assembled from foreign parts. A Dell server “assembled” in North Carolina with Korean, Chinese, and Taiwanese components counts as 100% American output, masking the true extent of industrial hollowing-out.
I view it as a “mutually assured value destruction” if you will.
Chen, the PBOC researcher, considered the “nuclear” option of China’s exclusion from SWIFT, and concluded that increasing cooperation with the US was the best way to shield China.
“The mutual penetration of the Chinese and American economies will inevitably weaken the willingness to impose financial sanctions.”
Correlations to rest of the portfolio
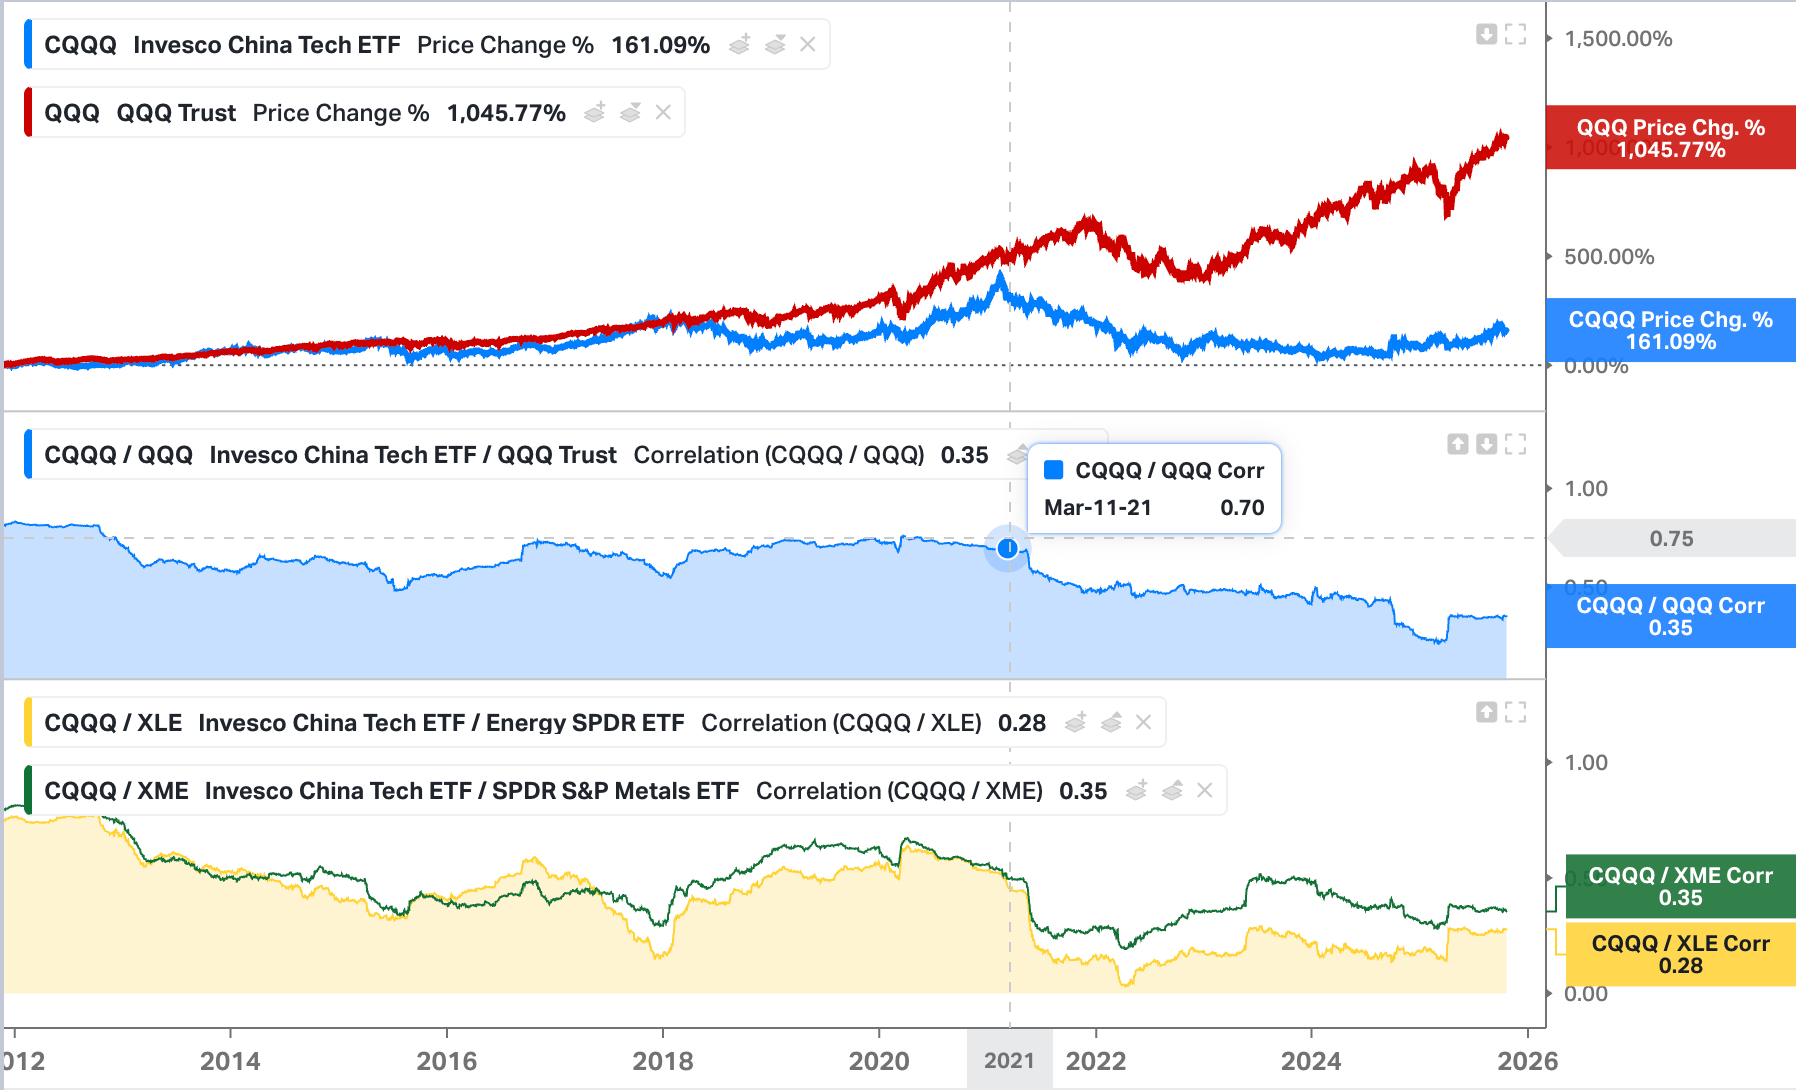
A big attraction of Chinese tech for me is the lack of correlation to the rest of my portfolio. It is fascinating to see how the correlation with US tech was very tight (0.7-0.8) until 2021, when it broke down and bottomed at 0.21 in March this year. Chinese tech runs a similarly low correlation to energy (XLE) and miners (XME).
*I’m using CQQQ in place of the Hang Seng Tech as the index was only created in July 2020.