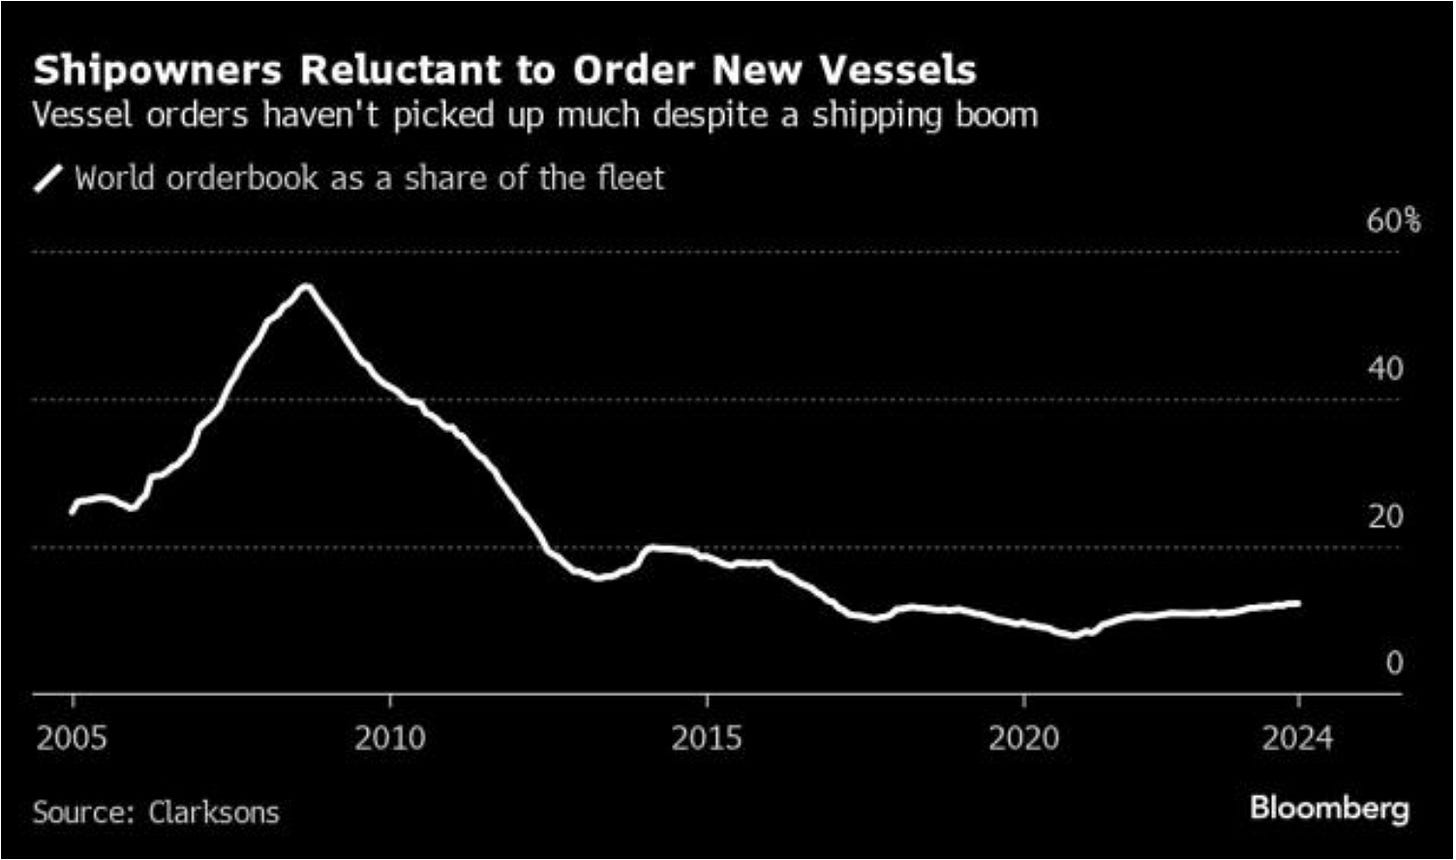
Shipping is about as cyclical as you get, and when looking at the global orderbook to fleet ratio, it's pretty clear we are at the bottom of the cycle.
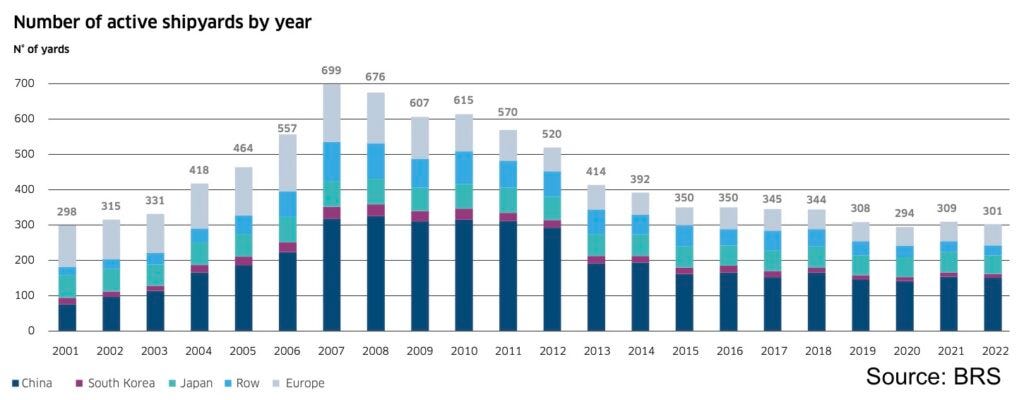
Shipyard capacity is down roughly 60% from the 2008 peak. With the reduced yard output, sectors that experience higher rates can quickly use up the limited capacity, setting the stage for longer build times and tighter supply for those at the back of the queue.
Both containerships and LNG have clogged a large chunk of global shipyard capacity until late 2027.
This leaves dry bulk, tankers, and offshore to compete for that limited shipyard capacity once they achieve the rates required to justify newbuilds.
Who's at the back of the newbuild queue with the most supply (shipyard) constraints?
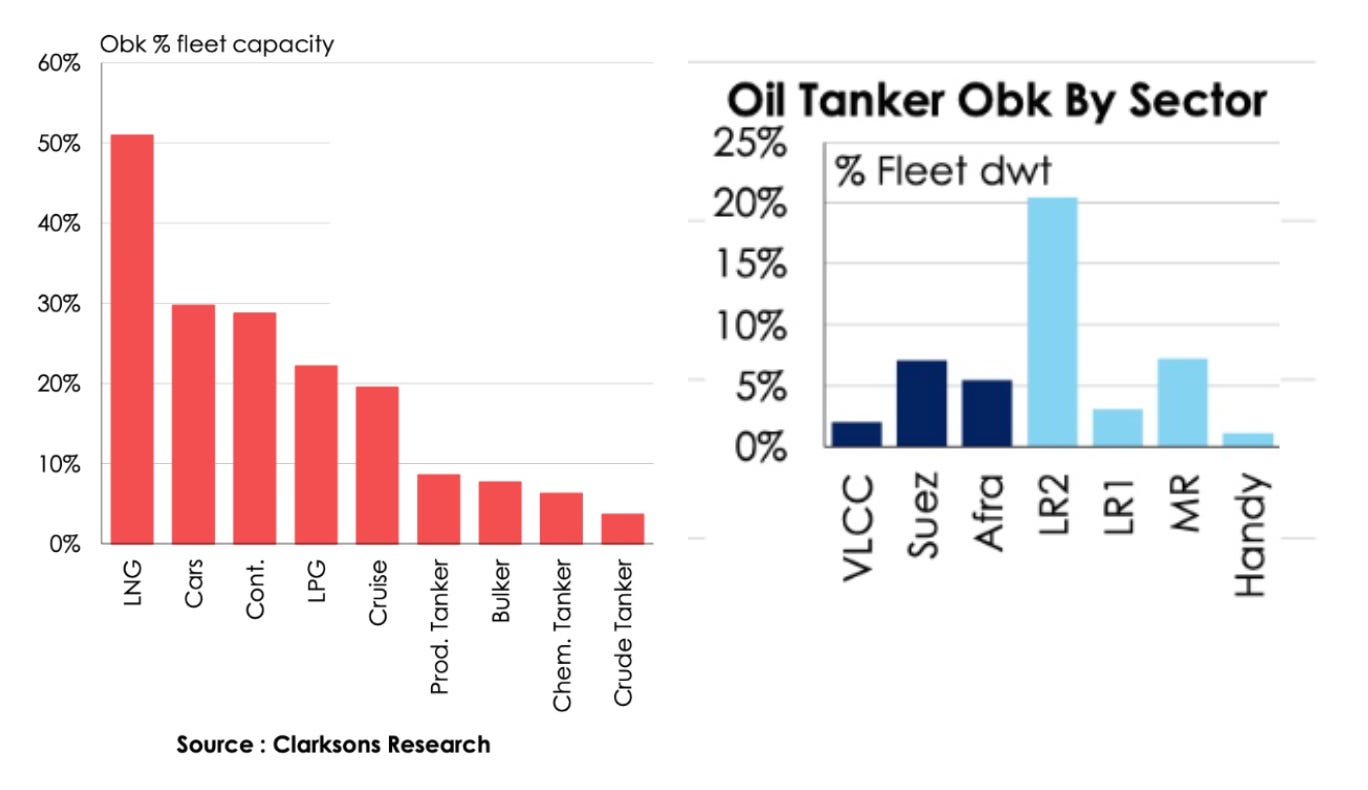
The chart below gives a good overview of each sector's relative position in terms of orderbook to percentage fleet capacity.
It's no surprise that tankers, and in particular VLCCs, are at the back (granted, offshore OSVs/rigs aren't on this chart).
Revisiting some of the charts from Alexander's presentation, it really comes down to VLCCs and Capesize if you want the torque (ignore Panamax, as it's tiny and being run off).
The thing that sticks out with tankers is the percentage of the fleet above 20 years old, which is important when you consider the average VLCC gets scrapped at 22 years old (24 years for Suezmax and 22 years for Aframax). With Capesize, it only stands at 3.1% with an average scrapping age of 22 years (granted, Capesize is interesting with so many built in a tight window of time with the 2009 order book hitting 80%; there is a good argument for one hell of a bull market at some stage).
After a brutal decade, active global shipyards are back to the level we had in 2001.
Shipyards will have to increase capacity (which is a whole opportunity in itself, which I plan to get to soon) if they are to replace the aging proportions of the dry bulk, tanker fleets and offshore fleets.
What about Offshore OSVs and Rigs?
Contrary to some of the headlines we have been getting lately, the setup still looks great to me, as the below needs to be put into context vs the fleet size.
The OSV fleet currently consists of 4,160 vessels, with 943 being laid-up. The number of laid-up vessels steadily decreased from 1,369 units in Q1 2021 to 1,053 units in Q4 2023, with a further 10% drop since then.
Of that, the remaining 943, less than a third are deemed "premium" vessels, i.e., those less than 15 years old (so we likely see continued scrapping since many operators have age restrictions < 15 years).
The OSV order book is now below 5%.


